


We have launched E-mail Alert service,subscribers can receive the latest catalogues free of charge

Ten-year Outlook: Decline of Potential Growth Rate and Start of a New Phase of Growth
Aug 12,2015


Liu Shijin, Chen Changsheng& He Jianwu
The reform and opening-up strategy initiated in 1978 opens the era of China's economic take-off in a modern sense. Over the past 30 years and more, China has maintained a high average annual economic growth rate of 9.8%. From 1978 to 2012, as the most populous country in the world,China witnessed a soar of per-capita GDP from USD 154 to USD 6,060 in less than two generations, which, if computed by PPP, grew from 220 international dollars1to 9,100 international dollars; China rose up from a low-income country to an upper-middle income country; China's trade of goods, once only accounting for less than 1% of the world total, soared up to make the country the world's largest exporter of goods; China overtook the U.S. in terms of the added value of manufacturing industry, becoming the world's largest manufacturer, and; China has, next only to the U.S., become the world's second largest economy with the aggregate GDP of up to USD 8.2 trillion. Throughout the history of human civilization, few countries could outshine China with such dazzling achievements that well deserve the title of "the China Miracle". However, it is a common sense that high growth rate is only a temporary phenomenon in a longer time horizon. Being on a specific development stage and in a context of changing global economy, China has demonstrated different characteristics on its path of economic growth: the potential economic growth rate starts falling gradually and meanwhile the economy is running with more vulnerability. If China succeeds in shifting the phase of growth and transforming the growth mode, it will enter into a new phase of growth, which, though at a slower pace, is full of opportunities, characterized by a more vigorous, innovative, and sustainable development and much closer to the goal of building a "moderately prosperous society" in a comprehensive way.
I. Two Types of Decline after Rapid Growth in Catching-up Economies
Throughout the history of economic growth in different countries (economies) since the Industrial Revolution, economic take-off and decline alternate and there is not a single country that could maintain permanent high growth. The distribution and trajectory of growth can be classified into the following several categories (Liu Shijin and et al., 2011).
The first category is the leading countries such as the U.K. and U.S. They have long been on the front edge of global technological advancement and served as the major source of technological revolutions. Their growth is often manifested in the upgrade of demand growth and formation of new industries driven by breakthroughs in supply (technology). And the typical feature of this growth pattern is having a relatively low but very stable growth pace which lasts long (See the dotted line in Figure 1).
The second category is countries that fail to take off, such as some sub-Saharan countries. They have long been mired in the Malthusian Cycle, failed to embark on the course of modern industrialization and long remained at a low economic level with low economic growth rate.
The third category is the catching-up countries featured with extrusive growth. These countries often look up to the leading countries as role models, draw on theexperience in technology, management, market and institution, strive to catch up with the leading countries by giving full play to their late-mover advantage and abundant natural resource endowments, and thus reach a certain point of development level within an obviously shortened period of time. For instance, for the per-capita GDP to rise from 1,800 to 11,000 international dollars, leading countries spent over one hundred years: 141 years for the U.K. and 109 years for the U.S. But evidently it took less time for catching-up countries to reach this goal: 54 years for Japan, 37 years for Singapore, 31 years for Hong Kong SAR of China, and 27 years for South Korea and Taiwan of China. For these countries, the lower their per-capita GDP is at the time of economic take-off, the higher the economic growth rate would be during the catching-up process; the later the economic takes off, the shorter the time would be to arrive at a certain point of development. Among the economies with rapid growth after World War II, most fall within this category, and Chinabelongs to one of them.
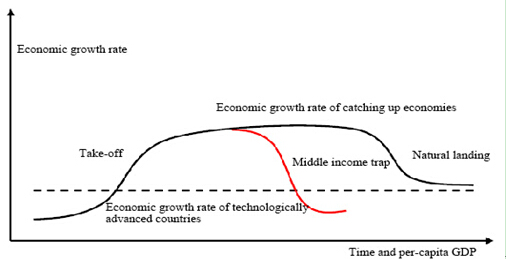
Figure 1 Types of Economic Growth Trajectory
The above classification mainly focuses on the economic take-off and the growth rate, but it paid no attention to the issue of landing. In conventional mainstream economics, it is believed that once taking off, the economy will go through the whole process of growth naturally. But history shows that not every economy could successfully complete the whole process of industrialization and achieve a steady economic landing after the take-off. Since 1960, 101 economies around the world have stepped into the group of middle income countries; and by 2008, only 13 of them developed to be high-income countries, completed their epic mission of catching up and succeeded in natural landing at high income levels (their economic growth pattern is shown in the right part of the solid black line in Figure 1). These successful economies include Japan, South Korea, Taiwan of China, Hong Kong SAR, Puerto Rico, Mauritius, Singapore and Israel. Most countries failed to complete this process, witnessed economic stagnation or even recession due to various reasons during catchingup, and fell into the "middle income trap2" (their growth pattern is shown by the red line in Figure 1). Examples include some Latin American countries and countries of the former Soviet Union.
So it is clear that with the end of the high-speed growth during the catching-up process there are two different scenarios: one is a natural landing, featured with successful industrialization, slowdown of the economic growth after the completion of the catching-up mission and the production (or growth)peaks of representative industrial products such as infrastructure, housing, iron and steel and cement roughly at the same period. A natural landing normally starts when the per-capita GDP reaches 11,000 international dollars. For example, Germany, Japan and South Korea, which caught up successfully after the World War II, all followed this pattern3.Another scenario is an unnatural landing, which means the mission of catching up fails when the catching up process is interrupted due to problems in the economic system, development strategy, and social differentiation, or for other reasons, and the economy is mired in stagnation or recession for a long time. It normally starts when the per-capita GDP is 4,000–6,500 international dollars. Here, the economic growth slows down sharply–mostly by more than 50%4–though the process of industrialization is not finished yet. Thus, the economy gets stuck in the middle income trap.
After the international financial crisis of 2008, especially since 2011, the Chinese economy has taken on some new characteristics, making people show more and moreconcern about the fact that what a landing will China have in its economic catching up process and will it be a natural landing or a fall into the middle income trap?
...
If you need the full context, please leave a message on the website.
1It refers to the Geary-Khamis dollar commonly known as the international dollar. The purchasing power parity in this article is computed in terms of G-K dollar which takes 1990 as the benchmark year.
2There is no clear and well-accepted definition of the "middle income trap". It roughly describes such a phenomenon: when a country gets rid of the Malthusian Cycle, its economy, featured with industrialization, will see the start of economic growth in a modern sense; its per-capita average income will improve significantly in a period of time, making it a middle-income country. But as it tries to become a high-income country, its economy stagnates or recedes for a long period and fail to grow into a high-income country due to certain internal or external influences or shocks.
3From 1947 to 1969, Germany's average annual growth rate was 7.9%; in 1969 when its per-capita GDP reached 10,440 international dollars, its GDP growth slowed down evidently. From 1970 to 1979, its average annual growth rate was only 3.1%. In Japan, the average annual GDP growth rate from 1946 to 1973 was 9.4%; and after its per-capita GDP reached 11,434 international dollars in 1973, its economic growth decelerated, and; from 1973 to 1983, its average annual growth rate dropped to 3.2%. In South Korea, the annual GDP growth rate averaged at 7.9%; in 1995 when its per-capita GDP reached 11,850 international dollars, its economic growth also slowed down evidently, and the growth rate averaged at 4.6% in the period between 1996 and 2008.
4For instance, from 1981 to 2000, Brazil, Argentina and Mexico's economy slipped into protracted stagnation, and their average annual GDP growth rates dropped by 67.6%, 50% and 58.5% respectively in comparison with the averages during their rapid growth period (1950-1980). Again, from 1950 to 1975, the average annual GDP growth rate of former Soviet Union, Hungary, Romania and Poland was 4.8%, 4.1%, 6.5% and 4.6% respectively while during the period from 1976 to 2000, their average annual growth rate dropped to -0.6% (for former Soviet Union, the figure was the aggregates of all member countries after its disintegration), 0.7%, -0.6% and 1.5% respectively.


