Analysis and Policy Options for Addressing Hidden Risks in Current Real Estate Market
Jul 03,2015
By Ren Xingzhou, Liu Weimin & Shao Ting, Institute of Market Economy of DRC
Research Report, NO. 48 2014 (Total 4547)
I. Major Changes in the Total Scale and Structure of Chinese Real Estate Sector
Since the comprehensive reform of the housing system implemented in 1998 in China, the housing sector has become increasingly market-oriented, with investment rising prominently and supply expanding rapidly. Between 1998 and 2013, residential investment growth in urban areas had averaged 19% annually from RMB431.1 billion yuan to RMB5.8951 trillion yuan. Urban residents had witnessed much improved housing conditions, with per capita floor space rising from 18.7 square meters in 1998 to 32.9 square meters in 2012 (Figure 1).
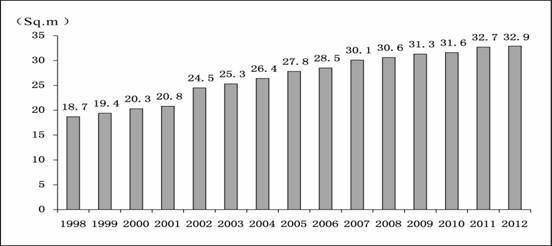
Fig. 1 Per Capita Floor Space for Chinese Urban Residents
Source: WIND Information.
There has been a considerable increase in completed commercial housing, bringing with it a constantly higher total urban housing supply and notably larger housing stock since 1998. According to the estimate by the Research Group of the Development Research Center of the State Council (hereinafter referred to as the Research Group) based on the sixth national census data, an average urban household had owned about one residential unit by the end of 2012. International experience indicates that supply and demand in housing market will tend to reach a balance at this aggregate level.
China's housing guarantee system has formed and kept improving amidst continuous progress in commercial housing market and residential conditions. Notably after the initiation of its 12th Five-Year Plan, the accelerated construction of government-subsidized housing units① has benefited more people. By the end of 2012, China had addressed the housing needs of an accumulative total of 31 million urban households by offering in-kind benefits, covering 12.5% of the whole. If 36 million government-subsidized houses could be smoothly under construction during the 12th Five-Year Plan period, that will help an accumulative total of 51.78 million urban households, covering 20.4% of the urban total by the end of 2015. With housing market structure considerably transformed, the government will play a more positive role in meeting the needs of low-and-middle income urban households.
Some pressing problems emerge amidst the development of housing market, despite continuously improved urban residential conditions and gradually expanded housing guarantee coverage.
First, though total urban housing supply has increased, some houses are still in poor conditions. Some even have no independent toilets and kitchens. According to the estimate by the Research Group based on the sixth national census data, an average urban household owned 0.73 units ( flats with both toilets and kitchens) in 2010 (most houses without independent kitchens and toilets were built in the period of the 1950s to 1970s).
Second, housing occupancy is actually unbalanced among urban residents. In terms of the total, there has been about one housing unit per urban household. However, there is uneven housing distribution among urban households: Some have two or more housing units while some still have none.
Third, since 2003, the sale price of commercial housing has entered a cycle of rapid rise. The price went up from RMB2,197 yuan per square meter in 2003 to RMB5,850 yuan per square meter in 2013 nationwide, with an annual average rise of 10.3%. Such trend is more prominent in the first-tier cities and some second-tier cities. Swift urbanization, higher income for urban residents, households' fission and increase, government's policy option of boosting real estate sector and growing demand for investment and speculation in some period of time, all constitute factors propelling rapid urban housing price rise
(Figure2 & Figure3).
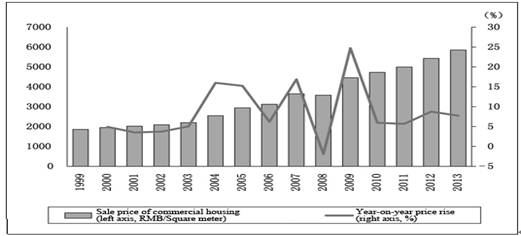
Fig. 2 Sale Price and Price Rise of Commercial Housing in China between 1999 and 2013
Source: WIND Information.
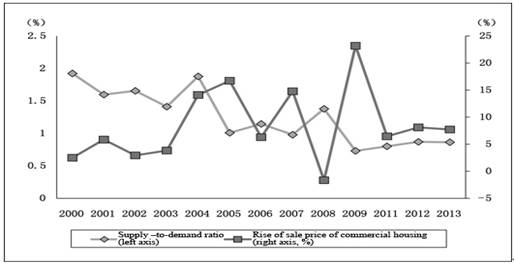
Fig. 3 Relationship between Commercial Housing Price Rise and the Structure of Supply and Demand
Source: WIND Information.
Fourth, housing market sees more prominent regional differentiation. At present, housing supply is relatively inadequate in first-tier and second-tier cities, where housing sales increase fast②. However, housing stocks continue to go up in third-tier and fourth-tier cities, many of which need an average deinventory cycle of 14 to 16 months. With supply falling short of demand, first-tier cities feel intense price rise pressure. Beijing, Shanghai, Guangzhou and Shenzhen have a year-on-year increase in housing price much higher than second-tier, third-tier and fourth-tier cities. Between September and December 2013, year-on-year rise of new commercial housing price index was up 20% for four months in a row in first-tier cities, and that in second-tier and third-tier cities stayed at roughly 11% and 8%, respectively (Figure 4).
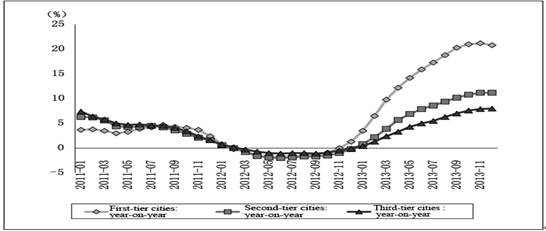
Fig. 4 Price Rise of New Commercial Housing Compared with the Same Month of the Previous Year in China
Source: WIND Information.
Fifth, in those large-scale government-subsidized housing projects, the government faces financial pressure and the need of stable capital source. And after the completion of such projects, it will have to focus on fair and reasonable distribution and future management after houses are put into use.
II. Hidden Risks Requiring Close Attention in Current Real Estate Market Operation
1. Risks to be prevented in regular drop of real estate investment
As the total supply and demand gradually move towards equilibrium, real estate investment has less growth momentum, together with slowdown of economic growth, fast investment expansion over the previous years will be hardly sustainable. As a rule, real estate investment will experience a slowdown in the future (Figure 5).
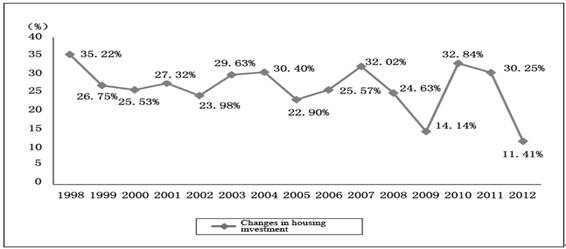
Fig. 5 Changes in Housing Investment in China
Source: National Bureau of Statistics of China
In 2013, real estate investment actually made rose 19.8%, obviously lower than that in previous years. Between 2011 and 2013, the annual land acquisition averaged 396 million square meters nationwide and annual completed housing reached 978 million square meters, respectively up 5.3% and 46.3% over the 11th Five-Year Plan period. This means the expansion of land supply is far behind that of completed housing. Therefore, real estate development and investment are bound to see a downward trend with insufficient driving force for construction growth (Figure 6). Meanwhile, unlike considerable expansion of new housing in past few years, with plenty of urban housing stocks, current market transaction has been equally divided between housing stocks and newly-built housing in some large and medium-size cities. This will invariably lead to relatively reduced consumer demand for new commercial housing, thereby dampening the growth of real estate investment.
The current regular slowdown of real estate investment is bound to affect the growth in fixed assets investment, whose important role in driving China's economic growth tend to be lessened, and local fiscal resources, taxes and employment will be affected as well. Therefore, we should prevent a sharp slowdown in housing investment. And more importantly, we should take precautious measures against the blind attempts to stimulate investment by means of relaxing credit, land or taxes, which tend to bring more risks.
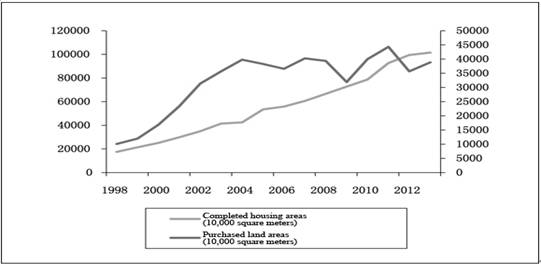
Fig. 6 China's Completed Housing Areas and Purchased Land Areas between 1998 and 2013
Source: National Bureau of Statistics of China
…
①Government-subsidized housing project consists of housing guarantee and renting subsidy. Housing guarantee includes government-subsidized housing and rebuilding of various shantytowns. Government-subsidized housing projects includes low-rent housing, economically affordable.
② First-tier cities refer to Beijing, Shanghai, Guangzhou and Shenzhen. Second-tier cities refer to provincial capital cities and cities under separate state planning with vigorous supply and demand in real estate market.
The article was published in China Development Review, No. 2, 2014.
If you need the full text, please leave a message on the website.


