


We have launched E-mail Alert service,subscribers can receive the latest catalogues free of charge

A Survey-based Analysis on Current Business Efficiency of China's Industrial Enterprises
Dec 28,2012


Zhao Changwen & Xu Zhaoyuan
From January through August 2012, the business efficiency of China's industrial enterprises slid down dramatically along with the notable slowdown of China's economic growth. Many enterprises found themselves in operating difficulties and even losses were incurred among all enterprises of the same industry. Cyclical factors, such as the slowdown of both domestic and overseas demand, some medium- and long-term tendencies, such as the rising factor cost, and some contradictions and problems stacked up along with the rapid economic growth, such as the overcapacity, were the reasons for the decline. As a result, it is still hard to thoroughly overcome the present operating difficulties facing enterprises, and efforts should be made to deal properly with both symptoms and root causes so as to effect a permanent cure
I. Business Efficiency of Various Types of Enterprises Slides Down Remarkably, yet the Overall Performance Remains Normal
1. Production remains slow and profits are reduced from a year earlier
With the constant slowdown of the industrial growth, the profits earned by enterprises have reduced substantially year on year. Since the latter half of 2011, the Chinese economic growth has slowed down gradually, and such a slowdown had been more obvious in the first half of 2012. From January through August 2012, the industrial enterprises above designated size (i.e. all state-owned enterprises and those non-state-owned enterprises with an annual sales revenue over 5 million yuan) reaped a profit of 3.06 trillion yuan, down 3.1%, year on year. Sales profits have reduced drastically, with the sales profit ratio being 5.31% from January to August, down 0.8 percentage points as compared to 6.07% recorded during the same period of last year.
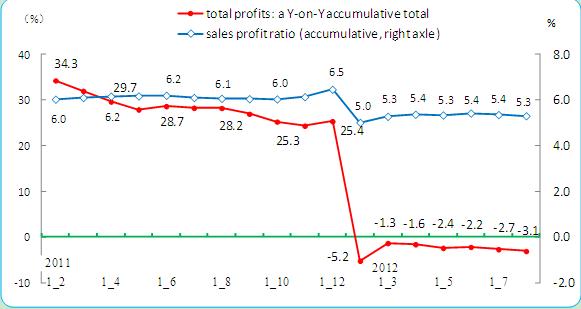
Figure 1: Total Amount of Profits Earned by Industrial Enterprises and the Growth of Profit Ratio
The number of enterprises running in the red has increased considerably from a year ago and the percentage of loss-incurring enterprises remains at a higher level. From January to July, the number of loss-incurring enterprises reached 53,000, up 26.2% over the previous year, and the percentage of loss-incurring enterprises came to 16.2%, up 3.5 percentage points as compared with the same period of last year. The amount of losses incurred by the enterprises reached an accumulative total of 420 billion yuan, an upsurge of 64.40% as compared to 238.2 billion yuan of losses incurred in the same period of last year.
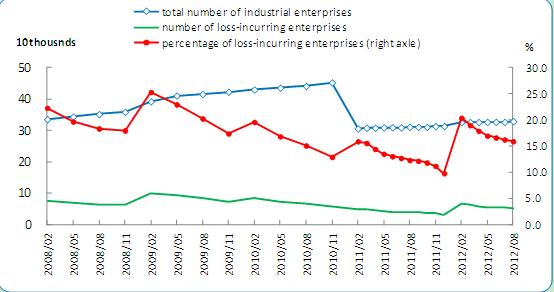
Figure 2: Number of Loss-incurring Enterprises and Percentage of Loss-incurring Enterprises
Recent survey findings indicate that nearly 300 enterprises in ten provinces, autonomous regions and municipalities in China's eastern, central and western regions have shown that, despite the large differences among different industries, business operations conducted by enterprises in the first half of 2012 were universally much poorer than in the same period of last year, and even business operations conducted by some industries and in some regions were worse than in 2009 when the international financial crisis hit the bottom. For example, almost all textile enterprises incurred losses or earned slim profits. Some enterprises said that “neither production nor sales boom, therefore, life and death depends on the sudden turn of fortune; with situations being worse both at home and abroad, we take pains struggling for survival between profits and losses”. A great number of iron and steel works and petrochemical enterprises incurred huge losses and, the larger the enterprises, the more difficulties they encountered in business operation. In terms of the equipment manufacturing industry, although the majority of enterprises earned profits, they scored a dwindling number of orders and were faced with the overall reduction of demand and the constant decrease of profit ratio. Relatively speaking, things turned out the best with pharmaceutical enterprises, with the latter maintaining a high profit margin on the whole. However, under the pressure of cost rise as well, those pharmacy firms saw evident reduction of their profits as compared to the previous year.
2. Profits of enterprises in China's western region and in Guangdong and Zhejiang Provinces in China's eastern region are reduced considerably
From January to August 2012, China maintained the rapid industrial growth in its central and western regions. From January to August, the growth rate of various provinces, autonomous regions and municipalities in China's central and western regions remained above 11% to 14.5% or so on an average, while the growth rate in China's eastern region stood at an average of 9.4% and that of the northeastern region registered 10.9% on an average, being evidently lower than that of central and western regions.
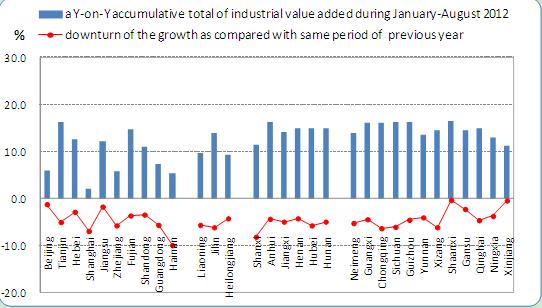
Figure 4: Growth of Industrial Value Added of Various Regions during January-August 2012
What merits attention is that, despite the rapid growth in China's western region, the total profits earned by enterprises in many regions reduced drastically as compared with the same period of last year. Among 12 provinces, autonomous regions and municipalities in China's western region, the total amount of industrial profits earned by 8 regions decreased as compared with the same period of last year, and 5 of the regions saw the decrease in excess of 20%, and profits earned by enterprises in Zhejiang in eastern China and those in Hainan dropped by 20% or so. Relatively, things were better with China's central region, where 5 of the 6 provinces maintained a positive growth, only the accumulative total of profits of Shanxi Province reduced by 21.6%, year on year.
3. Profits of investment- and export-driven industries are reduced drastically and the export-driven enterprises face the most difficult time in production and operation
In view of the ultimate demand impact, growth of business income and profits of investment- and export-driven industries has declined drastically as compared with the same period of last year1. Growth of sales income of most investment-driven industries dropped by more than 20 percentage points as compared with the same period of last year. For example, sales income from the manufacturing of general-purpose equipment increased by 10.0% from January to August, but the percentage was 32.3% in the same period of last year, down 22.3 percentage points. The profit total of many industries saw a negative growth as compared with the same period of last year. Profits earned by investment-driven industries, among others, such as non-metallic mineral products (building materials), smelting of ferrous metals (iron and steel), manufacturing of other transportation and communication equipment and waste materials, decreased by nearly 20% or higher year on year, and the profits of export-driven chemical raw material industry and chemical fiber manufacturing industry decreased by 21.3% and 52.5% respectively year on year.
The profit ratio reveals that export-driven enterprises are currently encountering the worst operational predicament. From January through July 2012, the sales profit ratio of all industrial enterprises was 5.31%, while such ratios of export-driven enterprises, except for those involved in the manufacturing of instruments and meters, were all lower than the average. Among others, the profit ratios of the chemical fiber manufacturing and computer manufacturing industries were 2.3% and 2.7% respectively, and such ratios of other enterprises involved in textile, furniture, stationery and sports products and chemical raw material manufacturing ranged from 4.4%-5.3%, showing an operating predicament on the whole.
…
If you need the full text, please leave a message on the website.
1According to sources of demand from different industries and the extent of the ultimate demand directly or indirectly fuelling different industries, we divide the industrial sector into consumption-driven (mainly household consumption and government consumption) industry, investment-driven (mainly fixed asset investment) industry, export-driven (mainly exports) industry, investment- and export-driven (similar investment- and export-driven roles) industry and jointly-driven (similar consumption-, investment- and export-driven roles) industry.


