


We have launched E-mail Alert service,subscribers can receive the latest catalogues free of charge

An Analysis of CPI Performance in the First Half of 2011 and Forecast for Its Future Movement
Dec 06,2011


By Liu Tao, Task Force on "Dynamic Analysis of China's Market Conditions", Institute of Market Economy of DRC
Research Report No 163, 2011
I. Main Features of CPI Performance in the First Half of 2011
In the first half of 2011, China's CPI rose by 5.4% year on year, up by 0.4 percentage points over the first quarter.
1. CPI performance remained at a high level and under a growing upward pressure
From January to June, the CPI growth declined before it went up as compared to the same period of the previous year, going up incessantly from 4.9% in January and February to 6.4% in June, hitting a record high over three years' time. The month on month growth went up and reached 0.3% in June (Figure 1) in June after a short fall in the first quarter. In addition, prices of eight major categories of commodities consisting of CPI during the first half of the year all went up in varying degrees from a year ago.
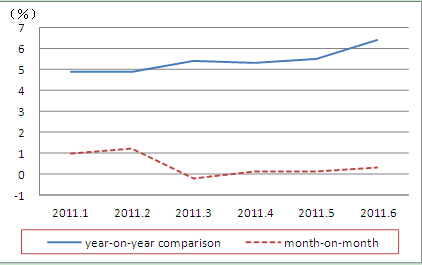
Figure 1 CPI Performance from January to June 2011
Source: National Bureau of Statistics.
2. Rapid growth of food prices such as meat and poultry drove upward CPI performance
During the first half of the year, food prices grew by 11.8%, year on year, playing the most conspicuous part in driving up CPI. According to the estimated average weight1 of the prices of eight categories of commodities to CPI, of 5.4 percentage points of CPI growth, the rise in food prices contributed nearly 3.6 percentage points, accounting for 65.7% of the CPI growth. By month, the contribution of food prices to CPI growth gradually decreased after reaching a high point in February and rebounded to 67.0% in June (Figure 2).
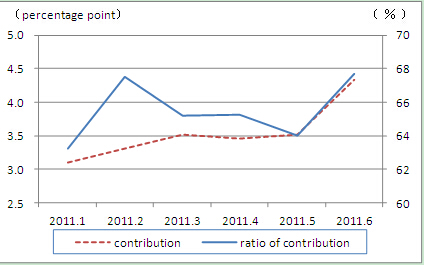
Figure 2 Contribution of Food Prices to CPI Growth and the Contribution Ratios from January to June 2011
From January to June, the drastic rise in prices of poultry and related products was the main factor for the upsurge of food prices. According to the estimates at the average weight of consumption expenditure food prices to food prices, the prices of poultry and related products surged by 19.7% year-on-year in the first half of the year, driving up food prices directly by nearly 4.1 percentage points, making up 34.3% (of which pork price rose by 31.7% year-on-year, driving up food prices by 2.8 percentage points, making up 23.7% of the food price rise) of food price rise; grain prices rose by 13.9% year-on-year, driving up food prices directly by 1.2 percentage points, making up 10.2% of the food price rise. Compared to the first quarter, the contribution of the rise in prices of poultry and related products in the first half of the year to food price rise increased by 8.7 percentage points, while the contribution of the rise in grain prices decreased by 1.5 percentage points.
3. The high housing prices were a major driving force for CPI growth
In the first half of the year, the monthly housing prices all rose by more than 6%, year on year, generating an accumulative total of 6.3%, down 0.2 percentage points over the first quarter. Estimates from the average weight of the prices of eight categories of commodities to CPI suggest that during the first six months housing prices drove up CPI by 1.2 percentage points, namely, of 5.4 percentage points of CPI growth, 22.3% were fueled by housing price rise. By month, the role of housing prices in fuelling the CPI growth had weakened from 26.5% in January to 18.5% in June (Figure 3).
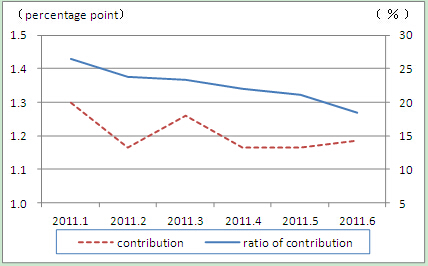
Figure 3 Contribution of Housing Price Rise to CPI Growth and the Contribution Ratio from January to June 2011
In addition, the contribution of the rise in prices of medical care, personal articles, household equipment and maintenance services to CPI growth in the first half of the year reached 0.3 percentage points and 0.1 percentage point respectively, making up 5.6% and 2.1% respectively of CPI growth; the contribution of the rise in prices of clothing, recreational, educational and cultural products and related services, cigarettes and alcohol and related articles, communications and transportation to CPI growth came to less than 0.1 percentage point, with the highest percentage making up no more than 2% of CPI growth. Thus it can be seen that the contribution of the housing price rise to CPI growth is second only to that of food price rise, becoming an important driving force behind CPI upsurge.
4. Carryover effect was a major factor for CPI growth and new factors are intensifying price rise
As the year-on-year CPI growth declined before it rose in the previous year, the high carryover effect resulted in a big pressure on CPI growth in the first half of 2011. Estimations indicate that the influence of the carryover effect on CPI came to about 3.4% in the first half of the year, making up 63% of the total growth. At the same time, varied factors including holidays and abnormal climate had intensified the new factors for the price rise. Of them, the influence of the new factors for the price rise reached 2.7% in June, making up 42.2% of the aggregate rise in the same month.
…
If you need the full text, please leave a message on the website.
1According to information on readjustment of CPI weight released by the National Bureau of Statistics and based on the regression model reflecting the contribution of the prices of eight categories of commodities to CPI from January 2006 to December 2010, calculations resulted in the average weight for the period from January to June 2011. Of this, foods accounted for 30.1%, cigarettes, alcohol and related articles for 2.9%, clothing for 8.8%, household equipment and related maintenance for 5.8%, medical care and personal articles for 9.4%, communications and transportation for 10.0%, recreational, educational and cultural products and services for 13.9% and housing for 19.1%.


