


We have launched E-mail Alert service,subscribers can receive the latest catalogues free of charge

Current Real Estate Performance and Policy Options for Further Improvement of Real Estate Market
Jul 28,2010


By Deng Yusong, Institute of Market Economy, Development Research Center (DRC)
Research Report No 023, 2010
I. Basic Judgment of the Current Real Estate Market Performance
1. Fast-growing sales volume and tight balance of supply and demand
In December 2008, to cope with the international financial crisis and the drastic decline of sales on china's domestic real estate market, the General Office of the State Council unveiled the Opinions on Promoting the Sound Development of the Real Estate Market and carried out favorable credit and tax policies aimed at encouraging housing consumption. Over one year's time since the implementation of the policies, marked effects have shown up. In 2009, sales of commercial housing across the country totaled an area of 937.13 million square meters, up by 42.1%, year on year.
Advance sales have been conducted for commercial housing in China. The overwhelming majority of commercial housing has been sold out before completion. Therefore, the sales to construction ratio of commercial housing 1can be used to precisely judge the supply and demand on the real estate market. During 1997-2004, the sales to construction ratio remained around 62% in China, the price rise was mild and the market supply and demand was regular on the whole. From 2005 onwards, with the rapid increase of the sales volume, during 2005-2007, the sales to construction ratio went up to 80% or so and the price rise became drastic, suggesting a tight balance in market supply and demand. From 2008 onwards, as reduction of sales of commercial housing widened month by month and the area under construction continued to increase rapidly, the sales to construction ratio began to decline. In 2008, the sales to construction ratio dropped to 64.33%,and the nationwide average housing sales price went down for the very first time since 1997. Since 2009, with the rapid increase of the sales volume of commercial housing, the sales to construction ratio went up rapidly once again. During the whole year, the sales to construction ratio reached 81.2%, being slightly higher than the peak value during 2005-2007, suggesting the appearance of another tight balance of market supply and demand over a short period of time.
2. Increasing price rise and price bubbles in some cities like Beijing
With the rapid increase of the sales of commercial housing, the housing sales prices in 70 large and medium-sized cities across the country witnessed a positive growth since March 2009 as compared to previous periods, with the rise reaching 1.5% in December, being the highest since 2008; in June, the housing prices turned from negative to positive from a year earlier, with the rise reaching 7.8% in December, year on year, being the highest since 2009. In terms of the nationwide average housing price, in 2009, the average housing price amounted to 4,500 yuan/M2, up by 900 yuan/M2 as compared to that of 2008, being the highest since the reform of the housing system. According to the National Bureau of Statistics, cities where rise of prices of newly-built homes has exceeded the national average mainly include such first-tier cities as Shenzhen, Hangzhou, Beijing and Shanghai. At present, the housing price-to-income ratio, the price-to-rent ratio and the housing affordability in some cities like Beijing and Shanghai have conspicuously deviated from the historical averages. For instance, at present the housing price-to-income ratio in Beijing is being over 50% higher than the ratio recorded during 1998-2006, suggesting that price bubble exists in these cities. Hence, we should pay close attention to this phenomenon.
3. Ascending rise of investment in real estate development
The continuous rise of housing prices and the rapid increase of the sales volume have given rise to the continuous increase of investment in real estate development across the country since March 2009. During the whole year, an investment in real estate development was fulfilled totaling 3.6232 trillion yuan, up by 16.1%, year on year. The area of homes under construction throughout the country reached 3.196 billion square meters, up by 12.8%, year on year; the accumulative rate of increase of the housing area under construction throughout the country began to turn from negative to positive since October. The area of homes under construction during the whole year reached 1.154 billion square meters, up by 12.5% from a year ago.
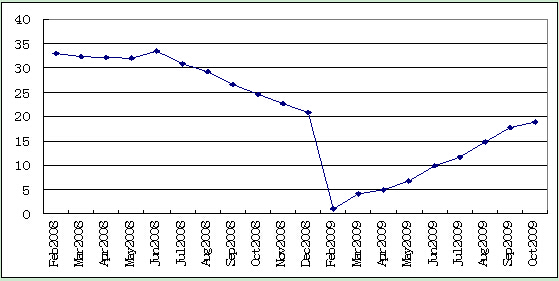
Figure 1 Increase of Investment in Nationwide Real Estate Development (%)
Source: National Bureau of Statistics
4. Ever-increasing regional differences of the real estate market
International experience and the development of China's real estate market have all shown that there have existed substantial differences on real estate market in different regions. For instance, since 1997, the area of commercial housing under construction across the country has maintained a rapid growth. But the area of the commercial housing under construction in Beijing reached the highest in 2003 and then began to decline year by year. Again, it can be seen from across the country that although the rise of the housing prices has been picking up since 2009 and the housing price-to-income ratio2 in 2009 calculated according to the countrywide data was up 15.6% as compared to 2008, however, the ratio is still equivalent to the average recorded over nearly 10 year's time (Figure 2). While the nationwide housing price-to-income ratio has basically remained stable, the housing price-to-income ratios in cities like Beijing have exceeded 50% of the historical averages, and the undersupply and the relatively high investment-speculative demand ratio are common problems currently facing some cities like Beijing. Currently, substantial differences have turned up in supply and demand and prices on real estate markets between some cities like Beijing and the rest of the cities across the country. Therefore, real estate macro-control policies should no longer be formulated according to real estate prices in such cities as Beijing and Shanghai to suit the whole country. For cities like Beijing and Shanghai where housing prices have conspicuously deviated from the normal levels, policies should be oriented toward the increase of supply and suppression of investment and speculative demand to ease the undersupply and bring down the relatively high investment-speculative demand ratio.
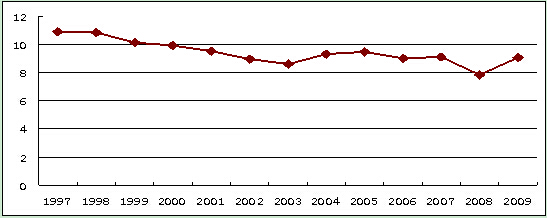
Figure 2 Changes of Nationwide Housing Price-to-Income Ratios
Source: Based on data recorded in China Statistical Yearbooks of various years and data for 2009 were figured out based on preliminary statistics.
…
If you need the full text, please leave a message on the website.
1Sales to construction ratio of commercial housing refers to the ratio of the sold commercial housing area to the area of new constructions during the same year.
2Housing price-to-income ratio: Data used in this paper imply the ratio of the total purchasing price of a home with its floor area reaching 100 square meters to the national average household disposable income during the same year, namely, the housing price-to-income ratio=the national average housing sales price during the year×100/ the national average household disposable income during the same year.


