


We have launched E-mail Alert service,subscribers can receive the latest catalogues free of charge

A Correct Understanding of Current Real Estate Performance for the Promotion of a Smooth Development in Real Estate Market
Dec 07,2009


By Liao Yingmin & Ren Xingzhou, Institute of Market Economy, the DRC
Research Report No 109, 2009
I. Characteristics and Basic Estimation of Current Real Estate Market Performance
1. The characteristics of the current real estate market performance
(1) The real estate market bottoms out
From January to August 2009, the area of nationwide sold newly-built commercial housing was 494,160,000m2, increased by 42.9% over the same period of the previous year, up 34.7 percentage points over the growth rate of the first quarter. The commercial housing sale reached 2346.4 billion yuan, rising by 69.9% year on year. The newly-built house sale exceeded that of a year ago. Analyzing by quarters, the area of nationwide sold commercial housing of the first quarter was 113,000,000m2, increased by 8.2% over the same period of the previous year. The medium-sized and small-sized houses with low total prices were sold relatively well, which shows part of accumulated rigid demands was released and it was in a steady recovery period. Since April, however, the commercial housing transaction amount saw a paroxysmal increase, and the transaction amount of some large-sized and medium-sized houses with relatively high total price increased rapidly, reflecting that the house purchasing structure had changed. The sold area of the second quarter reached 228,000,000m2 (that of June was 94,650,000 m2), which was 2.02 times that of the first quarter (Table 1). At the same time, the second-hand house transaction flourished as well. The second-hand house online treaty of the first half this year in Beijing and Shanghai increased respectively by 186% and 187% over the previous year, higher than the level of the year 2008; that of Shenzhen and Shanghai almost reached the level of 2008 as well. In the third quarter, especially in September, housing transaction amount of some big cities like Beijing and Shanghai decreased as deflation policy like high price and shortage of the second-hand house restrained most of the demands.
Table 1 Changes of Sold Area of Newly-built Commercial Houses in Different Regions (2009)
|
|
January-March (Unit: 10,000m2) |
April-May (Unit:10,000m2 ) |
Ratio of April-May to January-March (%) |
|
Nationwide |
11308.74 |
13335.7 |
17.92 |
|
East Region |
6253.49 |
7351.69 |
17.56 |
|
Beijing |
315.27 |
431.83 |
36.97 |
|
Jiangsu |
1368.78 |
1492.10 |
9.01 |
|
Zhejiang |
707.81 |
843.63 |
19.19 |
|
Guangdong |
1121.37 |
1073.77 |
-4.24 |
|
Central Region |
2221.49 |
2666.76 |
20.43 |
|
West Region |
2833.76 |
3317.25 |
17.06 |
|
Chongqing |
623.62 |
602.28 |
-3.42 |
|
Sichuan |
773.32 |
840.34 |
8.67 |
Source: Based on the data published by the National Bureau of Statistics of China
(2) The housing price is blocked in the course of rapid recovery
At the same time when the sold area of commercial housing was increased, and the sale price of housing showed a positive growth from March, the nationwide price increased by 0.2%, of which the sale price of newly-built house rose by 0.1%, which reversed the status of price decline since August 2008. By June, the sale price of the newly-built house in 70 large and medium-sized cities declined by 0.6% year on year, down by 0.7 percentage points compared to that of May. That increased by 0.8% month by month. The sale price of the second-hand house increased by 2.2% year on year, and increased by 1.3 percentage point over April. The sale price of the second-hand house increased quickest and housing price showed a trend of rapid increase (Figure 1).
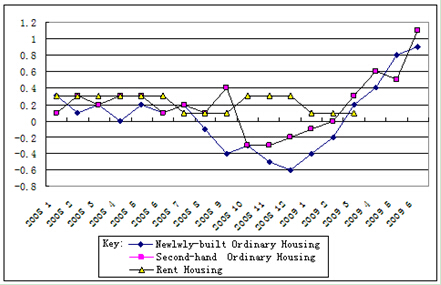
Figure 1 The Trend of Month-on-Month Growth Index of Various Ordinary Houses (Unit:%)
Source: Based on the data published by the National Bureau of Statistics of China
The housing price of the first-tier cities rebounded rather quickly such as Beijing, Shanghai and Shenzhen. The average housing transaction price of Beijing in the first half of this year had been rising sharply, nearly reaching the highest historical point. The average transaction price of the newly-built housing in June reached 13,302 yuan/m2, rose by 27%, an increase of 2,864 yuan/m2 over January. The transaction price of the second-hand houses in June was 1,266 yuan/m2 higher than that of mid-March (8,923 yuan/m2). The transaction price of new houses in May was 12,902 yuan/m2, rising by 17.4%, about 2,000 yuan more over February. The average transaction price of the new commercial house of Shanghai in June excessed 17,000 yuan/m2, while that of second-hand houses was nearly 14,000 yuan/m2, which created a new historical record. As the bargains of some big cities shrank, however, the housing price increase speed slowed down with discounted price.
(3) The growth rate of investment in real estate development sees a trend of gradual recovery
Some real estate developers showed greater passion in land purchase recently. From January to August, the nationwide real estate development corporations purchased 186,310,000m2 of housing land, declining by 25.3% year on year. The completed land development area was 149,200,000m2, down by 9.7% over the same period of the previous year with limited a decline.
From January to August, the newly constructed housing area was 631,000,000m2, declining by 5.9% year on year and the decline extent was 3.2 percentage points over the period from January to July. The completed national land development investment reached 21.147 billion yuan, rising by 14.7% year on year and with an increase of 3.1 percentage points over the period from January to July. The new housing construction area and development investment increased month on month, presenting a trend of recovery ( Figure 2).
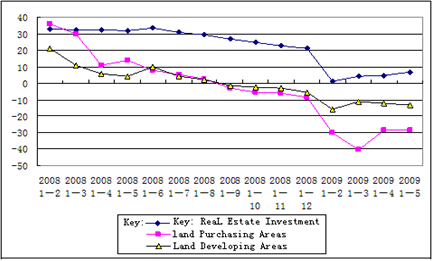
Figure 2 The Year-on-Year Growth of Real state Investment, Land Purchase and Development (Unit: %)
Source: Based on the data published by the National Bureau of Statistics of China
2. Analysis on the factors affecting the current real estate market performance
Through analysis, it can be found that the real estate market was recovering in the first quarter, and active in the second quarter. A variety of factors caused the recovery in the third quarter.
(1) The collective release of the home-based demands was the main reason for real estate market recovery in the first quarter.
The real estate market bottomed out and took a turn for recovery at the beginning of 2009 is mainly because the rigid home demands are collectively released under the macro-control policies. From beginning of the second half 2008, governments at all levels, from central to local, put forward a series of policies encouraging housing consumption and activating the real estate market, which decreased the cost by a large margin. Simultaneously, many developers were reducing the housing price to promote transaction in the process of adjusting the real estate market. The housing price declination made common people who took a wait-and-see attitude in light of the adjustment of real estate market for more than a year to purchase houses because their purchasing capability was obviously increased due to the housing price declination and incentive policies. It resulted in the recovery of real estate market.
…
If you need the full text, please leave a message on the website.


