


We have launched E-mail Alert service,subscribers can receive the latest catalogues free of charge

Performance Features of Logistics Industry1 in 2008 and Analysis of its Development Trend in 2009
Jul 27,2009


Wang Wei
I. Development and Overall Operation of Logistics Industry in 2008
Since 2008, despite the influence of various factors such as the slackening economic growth, frequent occurrence of natural disasters and the reducing overseas demand, China's logistics industry has maintained a rapid development on the whole. However, the development of logistics industry has slowed down with reduced efficiency, widened disparity in terms of its development and decreased service prices.
1. The logistics industry has maintained a rapid development with its growth gradually slowed down
In terms of logistics demand, from the first quarter to the third quarter of 2008, the logistics of the whole society totaled 68.1 trillion yuan, up a year-on-year 26.7%, an increase of 1.2 percentage points over the same period of the previous year2; from January to November the demand for basic logistics service or the freight volume of the whole society totaled 22 billion tons, up 11.9%, year on year, an increase of 0.8 percentage points over the same period of 2007 (Figure 1). Affected by the slackening foreign trade growth and the GDP growth, since October the growth of the nationwide freight volume has been evidently slowing down. In October and November, the nationwide freight volume went down by 0.4% and 7% month on month respectively; up 10.6% and 3.7%, respectively year on year, declining by 2.3 and 8 percentage points over the same period of the previous year, showing an obvious downward trend.
In terms of the size of the logistics industry, in 2008 the added value of the logistics continued to maintain a rapid growth, fulfilling 1.36 trillion yuan from the first quarter through the third quarter, up a year-on-year 16.8%, declining 0.8 percentage points over the same period of the previous year.
In terms of the capacity of the facilities, affected by such factors as the rigorous examination and approval of land supply, the shortage of bank loans, the snowstorms and the freezing weather, since 2008 the growth of the fixed asset investment in logistics industry has declined by a wide margin. From the first quarter till the third quarter, the fixed asset investment of the whole society in logistics reached 1067.5 billion yuan, up 13.5%, year on year, declining 5.3 percentage points over the same period of 2007, less 8.2 percentage points than the annual growth rate of 21.7% during 2003~2007, hitting an all-time low since 2002.
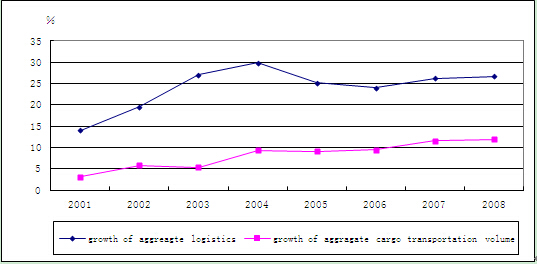
Figure 1 Change of the Total Demand for Logistics During 2001~2008
Source: China Federation of Logistics & Purchasing
2. The total costs for logistics have increased rapidly and its operating efficiency has shown a downward trend
From the first quarter to the third quarter of 2008, the total costs for the logistics of the whole society amounted to 3.8 trillion yuan, up 19.6% over the same period of the previous year, an increase of 2.4 percentage points from a year ago. Of this total, forwarding charges, possession money and management expenses increased by 15.5%, 25.5% and 20.4%, respectively, an increase of 0.7, 6.2 and 11.8 percentage points respectively over the same period of the previous year. Thus it can be seen that in 2008 the increase in labor cost and stock was the main factor accelerating the total costs for logistics in the whole society of China.
What merits attention is that in 2008 the costs for logistics accounted for 18.5% of GDP, up 0.2 percentage points over the same period of the previous year, being higher than the increase of 0.1 percentage point in 2007, thus changing the basic trend of the proportion of the costs for logistics in GDP continually reducing since 1991 at an average annual rate of 0.35 percentage points (Figure 2), suggesting that China's current efficiency of logistics in China's economic performance has reduced.
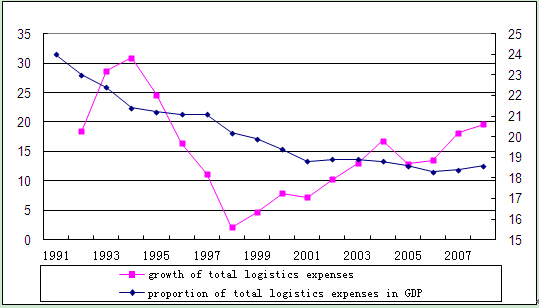
Figure 2 Change of Logistics Cost of the Whole Society During 1991~2008
Source: www.drcnet.com.cn China Federation of Logistics & Purchasing
3. The value-added logistics service has continually developed at an accelerated pace and the cargo transportation has notably declined
In terms of the added value of the logistics service, from the first quarter through the third quarter of 2008, the added value of the cargo transportation and the warehousing amounted to 965.8 billion yuan and 70 billion yuan, respectively, up 14.8% and 17.1% from a year ago and down 1.8 and 1.2 percentage points as compared with the growth rate of the same period of the previous year. By comparison, the growth of value-added service accelerated, with the added value of the delivery, circulation processing and packaging sectors totaling 115.8 billion yuan from the first quarter to the third quarter, up 33.6% from a year ago, an increase of 2.3 percentage points over the same period of the previous year.
It is worth mentioning that, affected by such factors as the frequent occurrence of natural disasters, the slackening macro-economic growth and the international financial crisis, the growth of China's major cargo transportation sectors has gone down in various degrees (Figure 3). Firstly, the road transportation has increased steadily as a whole. During the first three quarters of 2008 the road cargo transportation still maintained an accelerated growth on quarterly basis and such a growth fell continuously in the fourth quarter. The road cargo transportation volume during the whole year of 2008 grew by 11.2%, basically breaking even with the same period of the previous year. Secondly, the growth of the railway transportation has slowed down. In 2008, the countrywide railway cargo transportation volume and the turnover of the cargo transportation increased by 4.9% and 6.3% respectively, year on year, down by 3.7 and 2.8 percentage points over the same period of the previous year. Thirdly, transportation by water and at coastal seaports has gone down after the rise and, especially after September 2008, China's cargo transportation by water and the cargo handling capacity at its costal seaports have seen a downturn. In December, the volume of cargo transportation by water and the cargo handling capacity at the coastal seaports went down by 27.3% and 6.5% respectively, with the growth down by 4 and 12.8 percentage points over the same period of the previous year. Fourthly, the air transportation has remained sluggish during the whole year, especially since August 2008, the air transportation has incurred the negative growth in five months running. From January till November 2008, the volume and turnover of the cargo transportation by civil aviation registered 3.71 million tons and 108 million tons, up 1.6% and 2.9%, respectively, year on year, with the growth down 11.4 and 18 percentage points as compared with the same period of the previous year.
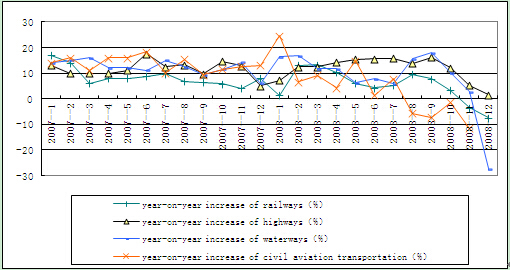
Figure 3 Growth of Transportation Volume by Major Transportation Sectors During 2007~2008
Source: www.drcnet.com.cn www.zgjtb.com
4. Logistics prices have seen an overall downturn
Except for the railway cargo transportation prices and the extra air fuel charges being increased by China in the first half of 2008, most logistics service prices determined by the market have all shown a downward trend in various degrees. The highway transportation prices have fallen after a gradual rise. From the first quarter to the third quarter of 2008, the highway transportation prices showed an upward trend as a whole and reached the highest in October 2008. The composite transportation price index amounted to 75.9, up 6.1 percentage points over the beginning of the year; in the fourth quarter, affected by such factors as the drastic reduction of international oil prices and the slackening economic growth at home and abroad, the highway cargo transportation cost and the transportation volume all reduced, causing the decline of highway transportation prices. By December, the highway transportation price index had amounted to 71.2, being slightly higher than that in the beginning of the year, but down by 4.7 percentage points as compared to the highest price level of the year (Figure 4).
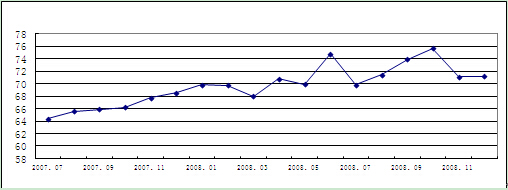
Figure 4 Changing Trend of Highway Transportation Price Index During 2007~2008
...
If you need the full context, please leave a message on the website.


