


We have launched E-mail Alert service,subscribers can receive the latest catalogues free of charge

Classified Studies on Small Enterprise Operations and Related Policies
Dec 09,2008


By Chen Xiaohong, Enterprise Research Institute of DRC and Xu Zhaoyuan & Yang Jianlong,Research Department of Industrial Economy of DRC
Research Report No. 134, 2008
In the first half of 2008, some Chinese industrial enterprises found themselves in operational difficulties and a consensus was that the development of small and medium-sized enterprises was more difficult. But statistical data indicate that of the industrial enterprises above the state-designated scale, the development of small enterprises was better than that of large- and medium-sized enterprises. The actual state of the development of small enterprises will impact on the evaluation and design of the policies on small enterprises and related macro-regulatory policies.
I. Overall Development of Small Enterprises Was Better than That of Large- and Medium-Sized Enterprises
Of the industrial enterprises above the state-designated scale, small enterprises account for 89.9% (314,000) of all industrial enterprises1. With their total output value accounting for 34.8%2and their employment accounting for 45.4% (at the end of June 2008), small enterprises constitute an important component of the industrial enterprises.
In the first seven months of 2008, small enterprises saw their total output value rising 38.0% to 10.6 trillion yuan. While their nominal growth rate was slightly higher than in the same period of 2007 (37.0%), their real growth rate was somewhat lower than in the same previous year. In the first five months of the year, small enterprises saw their total profit rising 45.1% to 322.7 billion yuan. Overall, the growth of small enterprises in the first half of this year was fairly fast. Compared with the large and medium-sized enterprises, the operational performance of the small ones were also better.
1. Total output value growth rate of small enterprises was visibly higher than that of large and medium-sized enterprises
Figure 1 illustrates the growth rates3of the total output value of different industrial sectors. Of the 38 industrial sectors, the growth rates of small enterprises in all sectors, except the tobacco-making sector (code number: 16) and the fuel gas production and supply sector (code number: 45), were about 10 percentage points on average higher than those of large and medium-sized enterprises.
2. Profit growth rate of small enterprises was higher than that of large and medium-sized enterprises
In the first five months, small enterprises saw their profit rising 45.1% year-on-year to 322.7 billion yuan, while large and medium-sized enterprises saw their profit rising only 13.0% year-on-year to 771.7 billion yuan. If both the sector of oil processing and coking and the sector of electricity production and supply, which were subject to price control, were excluded, the profit growth rate of large and medium-sized enterprises was 33.7% year-on-year. But the 52.1% profit growth rate of small enterprises was still much higher than that of large and medium-sized enterprises.
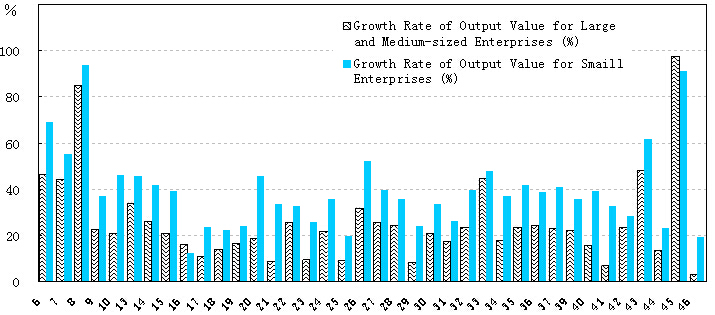
Figure 1 Growth Rate of Output Value of the Enterprises above Designated Scale in the First Seven Months of 2008 (at current price)
3. Sales-profit ratio of small enterprises was lower than that of large and medium-sized enterprises, but their assets-profit ratios were similar
In the first five months of 2008, the sales-profit ratio (total profit/sales revenue) of small enterprises was 5.00%, which was 1.47 percentage points lower than the 6.47% for large and medium-sized enterprises. But as small enterprises had a fairly higher productivity, their assets-profit ratio (total profit/total assets) was not low. In the first five months, the assets-profit ratio of small enterprises was 3.12% and that of large and medium-sized enterprises was 2.89%. After the sectors of oil processing, electricity and water subject to strict price control are excluded, the assets-profit ratio was respectively 3.52% for small enterprises and 3.77% for large and medium-sized enterprises. The difference was marginal.
4. Employment growth rate and net growth of small enterprises were all higher than those of large and medium-sized enterprises
In the first five months, a total of 35.54 million people were employed by small enterprises, which was a 7.23% growth over the same previous period. The net growth was 2.4 million jobs. During the same period, large and medium-sized enterprises employed a total of 42.75 million people, which was 1.46 million people more or 3.54% higher year-on-year. Their growth rate was visibly lower than that of small enterprises.
5. Proportion of money-losing small enterprises was lower than that of large and medium-sized enterprises
In the first five months, China had a total 343,800 industrial enterprises above the state-designated scale. While 23.16% of the 35,200 large and medium-sized enterprises suffered loss, 19.24% of the 308,500 small enterprises were losing money. The proportion of money-losing small enterprises was lower.
II. Analysis of Operational Performance of Small Enterprises of Different Categories
1. In terms of registration categories, private and other enterprises grew faster
In terms of total output value, private enterprises constituted the bulk of small enterprises. In the first seven months, private enterprises saw their total output value rising to 3.67 trillion yuan or 49.9% of that of all small enterprises. They were followed by foreign-invested enterprises and those invested by Hong Kong, Macao and Taiwan, posting a total output value of 1.61 trillion yuan or 21.9% of that of all small enterprises. The third category was other enterprises, which saw their total output value rising to 1.20 trillion yuan or 16.3% of that of all small enterprises. The remaining categories of small enterprises accounted for small proportions.
In terms of speed, both private enterprises and other enterprises posted a fairly fast growth, with their total industrial output value rising respectively 40.6% and 43.5% year-on-year. They were respectively 11.2 and 14.1 percentage points higher than the average growth rate (29.4%) of all industrial enterprises above the state-designated scale. The growth rate of foreign-invested enterprises and those invested by Hong Kong, Macao and Taiwan was 29.4%, at the same level of the average growth rate of all industrial enterprises.
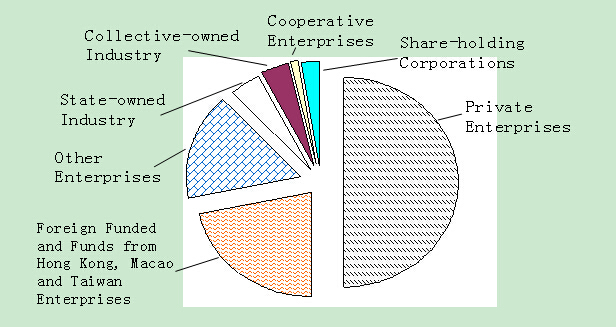
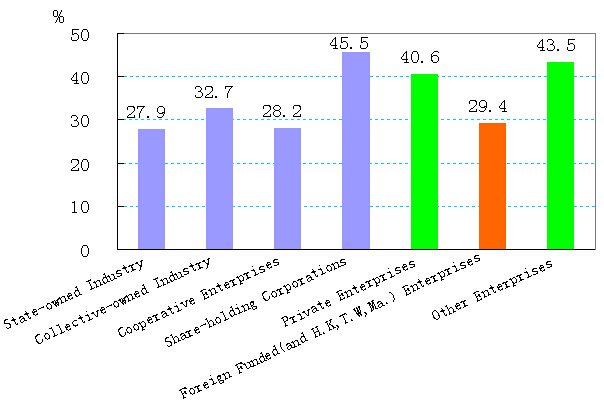
Figure 3 Growth Rate of Output Value of the Enterprises(Jan.-July, 2008)
2. In terms of industrial sectors, the growth rates of textile, garment and other export-oriented products and chemical fiber and plastic products were relatively low due to the impact of oil price hikes
Of small enterprises, the growth rate of those producing textile, garment, leather (including leather shoes), stationery and sports goods, a high proportion of which were export-oriented, posted a relatively slow growth, ranging between 20%~24%. They were 14~18 percentage points lower than the average growth rate of all small enterprises. The growth rate of those producing chemical fiber and plastic products was also low, which could be due to the crude oil price hikes and the insufficient supply of finished oil products and chemical products in the first half of the year.
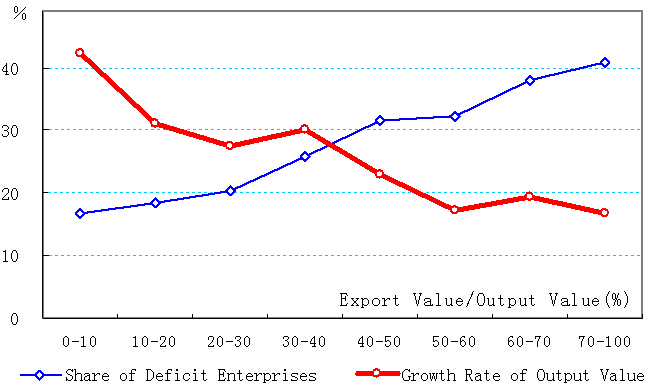
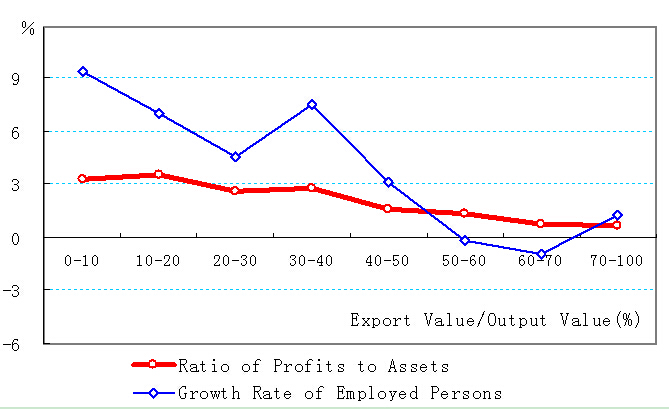
3. Growth rate of small enterprises in export-oriented sectors was low and their corporate efficiency was poor
In the first half of 2008, the operational performance of export-oriented enterprises was visibly poorer and that of domestic-oriented enterprises was better. As Figure 4 indicates, the export-oriented enterprises saw their industrial output value growth rate becoming clearly slower. The enterprises whose export accounted for 0~10% of their total output value posted an average growth rage of 42.4% (in the first five months), while the enterprises whose export account for more than 70% of their total output value posted an average growth rate of only 16.8%. More than 40% of the industrial sectors whose export accounted for more than 70% of their total output value suffered losses. Figure 5 shows that the profit rate and employment growth rate of small enterprises also dropped tangibly as their export proportion rose.
4. In terms of regional distribution, the growth rate of many small enterprises in the east coastal region was somewhat lower than in previous year
In terms of regional distribution, the development of small enterprises varied greatly between different regions. Compared with the same previous period, the regions posting a faster growth rate in nominal total output value were Shanxi, Inner Mongolia, Jilin, Heilongjiang, Anhui, Henan, Hubei, Guangxi, Shaanxi, Qinghai and Xinjiang. Most of these regions were noted for rich energy and resource reserves. On the other hand, Jiangsu, Zhejiang, Fujian, Jiangxi, Shandong, Guangdong, Hainan and Tiber posted a lower growth rate. Except Jiangxi and Tiber, all these regions are outward-looking developed provinces in the east coastal region.
…
If you need the full text, please leave a message on the website.
1Except stated otherwise, the small enterprises in this article refer to the small enterprises of the industrial enterprises above the state-designated scale.
2Nominal growth rate, excluding price factor.
3Nominal growth rate, excluding price factor. 38 industrial sectors were covered. No comparison was made for the other mining and dressing sector (code number: 11), because this sector had no large and medium-sized enterprises.
4Figures 4 & 5 were based on the 5,951 sets of data (31X7X39) of the tier-2 industrial sectors according to the registration categories in various regions (Data time: January~May 2008).


