Regional Differences Related to the Effectiveness of Monetary Policy and Underlying Causes
Oct 16,2008
By Wu Zhenyu, General Office of DRC
Research Report No. 101, 2008
Monetary policy usually maintains macro-economic stability and stabilizes internal and external shocks via affecting aggregate supply and demand. As a tool to control the total amount, monetary policy can work effectively on the condition that different regions within the same currency area share similar economic structures. That is to say, the currency area should meet the requirements of optimum currency area. There are always profound historical and political reasons behind the forming of currency areas. Not all currency areas in reality are optimum ones. How an economy could meet the requirements of optimum currency area, or how much the effectiveness of monetary policy can be affected, to some extent, relies on the different responses to the monetary policy of these regions. China, as a developing country in transition period, current market economy has not been perfected yet, with wide differences related to regional economies and finance development. The imbalance among different regional economies will inevitably induce differences of monetary policy in these regions and affect the effectiveness of the policy.
I. Quantitative Analysis of Regional Differences in the Effectiveness of Monetary Policy
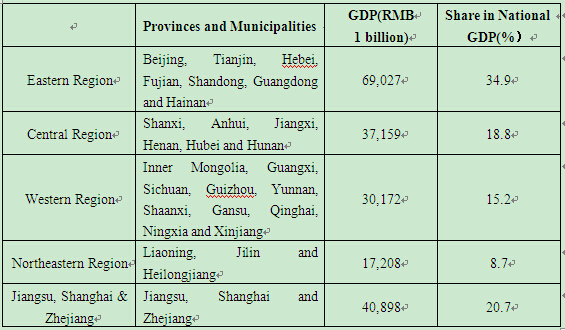
The regional differences in the effectiveness of monetary policy vary in the intensity and features at different levels. In this respect, the regional difference in the monetary policy is a relative concept, depending on what basic economic unit the researcher adopts for analysis. Selecting basic economic unit involves two issues, namely, regional scale and division. The former usually can be specified according to the research purpose, while the latter generally depends on the similarity among economic structures so as to reflect the real circumstances of regional differences. In view of these two aspects, this paper selects five regions as basic economic units for research. The table below shows which provinces or municipalities of China are included in these regions and the proportions of their economic aggregates in China.
The effectiveness of monetary policy in different regions can be analyzed quantitatively with impulse response function based on VAR (vector autoregression) model. This paper constructs a two-period lag VAR model with the data of GDP growth and monetary supply in 24 provinces between 1990 and 2006 (please refer to the appendix), and then studies the regional differences in monetary policy.
Table 1 Regional Division and its Share in National GDP

1. Differences in response features of regional monetary policy
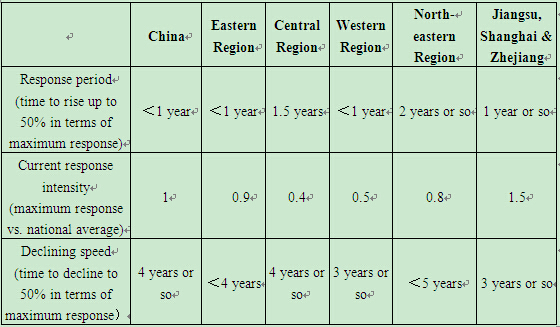
The impulse response function can be used to study the response of different regions to monetary policy. Table 2 lists the response of GDP growth rate in each region to the increase of unit standard deviation in monetary supply.
Table 2 Influence of Monetary Supply on Each Region


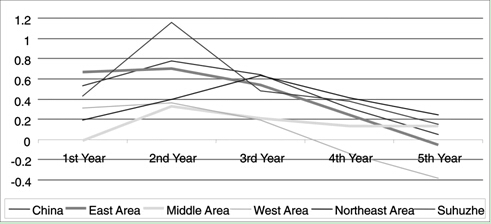
Chart 1 Responses of Monetary Policy to China and Each Region
According to Figure 1, the curves of eastern region and Jiangsu, Shanghai and Zhejiang are most close to the response curve of the whole country, with the response to monetary policy shock symmetric to the declining trend. The curve of western region has the left skewness and the effectiveness of monetary policy declines fast; the curve of northeastern region has the right skewness and the response to monetary policy is quite slow, while the response and declining in the curve of central region are both very slow.
The maximum response to monetary policy shock and the speed to reach the maximum in each region also vary. The curve of Jiangsu, Shanghai and Zhejiang has the highest maximum response among all five curves, followed by eastern region, northeastern region, western region and central region. Under the same influence of monetary policy, the response intensity in Jiangshu, Shanghai and Zhejiang is about 3 times higher than those of central region and western region and 50% higher than that of national level. The maximum response starts to appear at the end of the second year and the maximum response of northeastern region does not appear until the end of the third year.
2. Differences in response speed of regional monetary policy
We may analyze the response speed of each region to monetary policy by using the impulse response function, and the results are shown in Table 3.
In view of the time lag, the maximum shock on the whole country from monetary policy comes about 8 quarters later. In 4 quarters, the influence reaches about 50% of the maximum. Eastern region has the shortest time lag for monetary policy, reaching 80% of the maximum response within 4 quarters. Northeastern region and central region have a relatively slow response to monetary policy, with central region basically remaining silent in the first year and taking about 6 quarters to reach 50% of the maximum response, and eastern region reaching 50% of the maximum response in 8 quarters. The response period of northeastern region to monetary policy lasts the longest time.
Table 3 Responses of Each Region to Monetary Policy

The response to monetary policy in each region depends not only on the response of local economy to monetary policy, but also on the connection between local economy and other economies across the country. For instance, some region responds quite slowly to monetary policy but the local economy is very sensitive to the fluctuations in other areas. In this way, their response to monetary policy is much closer to the average level of the country. Due to the co-action of the two factors, there is no evident relation between the time lag of monetary policy and the development level of local economy.
3. Differences in response intensity of regional monetary policy
Within the whole response period, monetary policy exerts influence on macro-economy. Table 4 presents the accumulative influence of monetary policy on economic growth, which is much closer to the performance of the real economy.
…
If you need the full text, please leave a message on the website.


