


We have launched E-mail Alert service,subscribers can receive the latest catalogues free of charge

The Development Trend of Regional Disparity in China
May 06,2008


Li Shantong, Department of Development Strategy and Regional Economy of DRC, & Xu Zhaoyuan, Research Department of Industrial Economy of DRC
Since the late 1970s, with the implementation of the policy of reform and opening up, economic restructuring and fiscal decentralization, various regions have achieved high economic growth, gained more autonomous power in decision making and more initiative in economic development, and experienced a significant improvement in people's living standards. Even Guizhou Province, with the lowest per capita GDP, has experienced a 9.74-fold increase in economic aggregate from 1978 to 2005, with an annual growth of 9.2% at constant prices. Per capita GDP increased from 175 yuan in 1978 to 5,052 yuan in 2005, a three-fold increase with an annual growth of 7.6% at constant prices. However, China is a developing country with a big population and a large territory. Regional disparity is one of the crucial issues faced by China in its medium- and long-term development.
The analysis is based on recent updated statistical data that has become available since China implemented its first national economic census in 2004. In general, a number of adjustments had been made related to economic data during this census. For instance, before the census was made, the national statistical data for 2004 GDP stood at RMB 13.69 trillion yuan, but after the census it was changed to 15.99 trillion yuan, an increase of 17.8%. The provincial statistical data also witnessed many changes. For example, the statistics of GDP for Beijing, Shanxi and Guangdong Provinces showed an increase of 41.5%, 17.4% and 17.6% respectively whereas that of Heilongjiang, Hubei and Fujian Provinces showed a decrease of 10.4%, 4.8% and 10.7% respectively. The statistical data made through census reflected more accurately the economic development in different regions. This paper is based on the latest data for its analysis of regional disparity in China.
I. Regional Disparities among the Four Regions
Great differences exist in terms of geography, resources, economic and social development, and culture between China's coastal and inland regions.
From the changes in terms of per capita GDP, we could find clearly the comparatively changing trend of the overall development level among the four regions. Figure 1 shows that per capita GDP in the northeastern region was higher than that of the eastern region in the late 1970s. The ratio of per capita GDP in the northeastern region to that in the eastern region declined from 1.2 in 1978 to 1 in 1990; and the ratios of per capita GDP in the central and western regions to the eastern region also declined, but on a smaller scale. In the 1990s the gap between the eastern region and the other regions increased. After 2000, the changes in these ratios were smaller than they were in the 1990s. In 2006 the ratios of per capita GDP of the northeastern, central, and western regions to the eastern region were 0.66, 0.45, and 0.40, respectively. Compared with 2000, the ratios of the central and western regions have been stable in recent years.
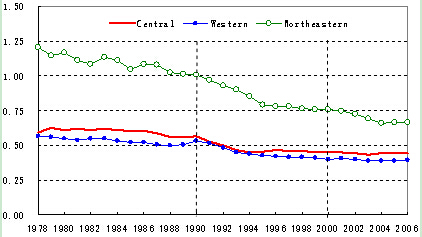
Figure 1 Comparison of Per Capita GDP in the Four Regions (Eastern Region =1)
Source: Provincial Statistical Yearbook 2006 (31 provinces).
In the 1980s, the growth rate of per capita GDP of the four regions differed little, with the eastern region experiencing a slightly higher growth rate. Beginning in 1990, however, the per capita GDP growth rate of the eastern region accelerated. Especially in the early part of the 1990s its growth rate was much higher than those of the central, western, and northeastern regions. The growth rate in the eastern region was 3.1–5.1 percentage points higher than those in the other regions. After 2000, the eastern region maintained a higher growth rate, but the difference between it and the other regions has narrowed. In 2006, the growth rate of the western, central and northeastern regions was a little higher than the eastern region.
In short, regional disparity was declining among the four regions in the 1980s, which was mainly due to the continuous decline of regional disparity between the northeastern and eastern regions. In the 1990s, especially in the first half of the 1990s, there was a significant widening of the gap among the four regions. This was mainly due to the extraordinarily high economic growth rate of the eastern region compared to the other regions. Since 2000, although there is still growth of the disparities among the four regions, the rate of increase has become relatively smooth. Disparities in per capita GDP among the four regions were stable in 2004 and 2005.
II. Inter-provincial Disparities
In China's administrative system, province is a major administrative level. Many studies have focused on regional income disparity based on provincial data. Over the past few years, the Central Government has launched the strategies related to the large-scale western development, the rejuvenation of northeastern region and the booming up of the central region, with the aim of narrowing inter-provincial disparity and enhancing the coordinated development among regions.
1. Trend of inter-provincial income disparity
Figures 2 shows inter-provincial disparities based on per capita GDP and household consumption at current prices. Regional disparities in terms of per capita GDP declined between 1978 and 1990. As shown in Figure 2, the Gini coefficient1 based on per capita GDP at current prices declined from 0.357 in 1978 to 0.276 in 1990, a decrease of 22.7%.
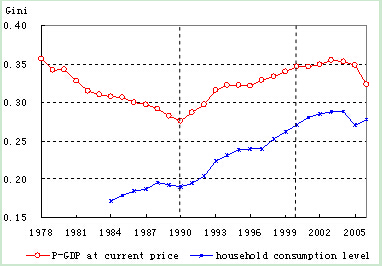
Figures 2 shows inter-provincial disparities based on per capita GDP and household consumption at current prices.
Sources: Provincial Statistical Yearbook 2006 (31 provinces).
…
If you need the full text, please leave a message on the website.
1Gini coefficient is a common indicator showing regional disparity with the value between 0-1. The higher the value is, the greater the disparity will be. The non-population-weighted Gini coefficient is in disregard of the population size in various regions and takes each region as a unit. The population-weighted Gini coefficient takes into consideration of the different size of population in different regions. The two measurement methods are different, but with similar changing patterns. Here it refers to the results of non-population-weighted Gini coefficient.


