


We have launched E-mail Alert service,subscribers can receive the latest catalogues free of charge

Optimization of Export Structure ShouldBe Based uponthe Upgrade of Industrial Structure
Apr 01,2007


By Lv Gang, Research Department of Foreign Economic Relations of DRC
Research Report No. 244, 2006
Since the policy of reform and opening up was introduced, huge progress has been made in China's foreign trade, with total export volume increasing in a rapid and continuous manner and the share of manufactured goods, mechanical and electrical products and high-tech products in exports significantly raised. However, many people believe that China's exports have expanded only in terms of quantity rather than quality and structure. What on earth should we evaluate China's export structure? This is, in fact, an issue of how to evaluate China's industrial structure which is mirrored in the country's export structure. Without a clear understanding of this, it would be difficult to judge the development phase of China's foreign trade and industrialization, and even more so to establish suitable policies to further raise the level of the country's opening-up and improve the quality of its economic growth. In an attempt to provide an answer to the above issue, this article analyzes the development of China's export structure since the mid 1990s and compares it with that of developed countries like South Korea, Germany, Japan and the United States.
I. Classification of Export Products
A commonly used way in analyzing the technological structure of a nation's exports is to classify them into 8 categories by one-digit codes of the Standard International Trade Classification (SITC) of the United Nations, in which Categories 0~4 are classified as primary products, Categories 6 and 8 as labor-intensive products and Category 5 and 7 as capital- and technology-intensive products. This classification is simple, but not accurate enough. For example, not all iron and steel products in SITC 6 are labor-intensive as some of them are capital-intensive. What's more, the characterization of capital- and technology-intensive products is too general.
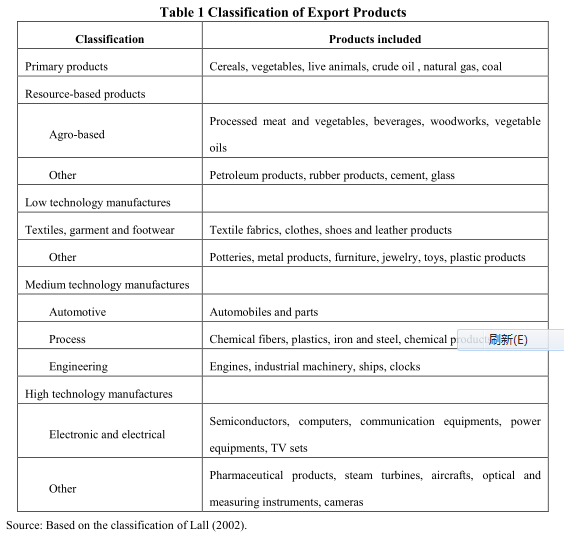
A more detailed approach[1] is to classify about 200 products, using the three-digit SITC codes, into 5 categories by the intensity of R&D inputs, namely, primary products, resource-based products, low technology manufactures,medium technology manufactures and high technology manufactures (See Table 1 below).
This approach has its own weak points. For example, it fails to distinguish the R&D intensities of the same product in different processing stages, or to reflect products upgrade and quality improvement. But since it is based on more detailed three-digit SITC codes, this method is apparently more accurate in classification of products in respect of technological level. Therefore, this approach is applied in the analysis of this article.
II. Analysis of China's Export Structure
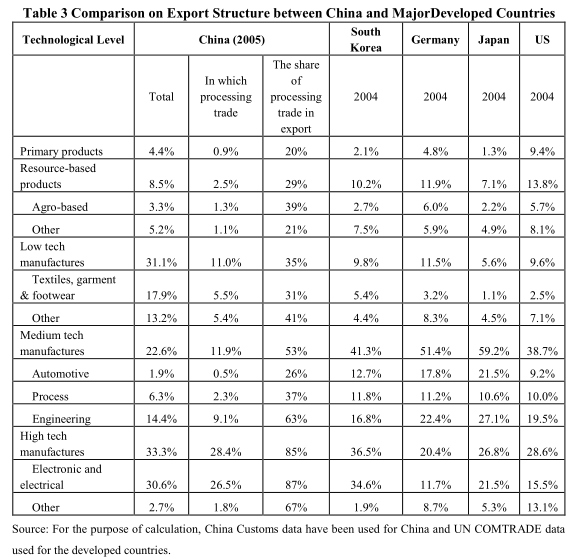
According to above approach[2], the author calculated the export structure of China from 1996 to 2005 and compared it with that of developed countries like South Korea, Germany, Japan and the United States ( See Tables 2 and 3).
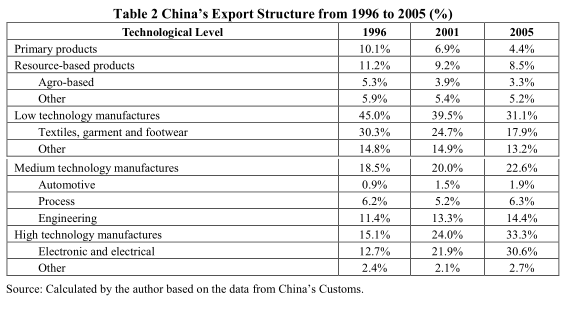
The dramatic increase of the exports of electronic and IT products have made them a new major driving force to keep China's exports booming, in place of those traditional products like textiles, clothing and shoes. The new export engine is also a new job generator. In 2005, the total number of employees in the electronic and IT products manufacturing industry[3] reached 6.71 million. Considering the strong boosting effect of the industry's development on related industries, the actual job creation effect of.IT product exports should be much greater.
...
If you need the full context, please leave a message on the website.
--------------------------------------------------------------------------------
[1] Professor SanjayaLall of the Oxford University made an in-depth study on technological progress of developing countries and published an article entitled "The Technological Structure and Performance of Developing Country Manufactured Exports, 1985~1998", in which he introduced this classification approach.
[2] This approach is originally based on SITC version 2. The author has changed its base to SITC version 3, according to the correspondence between these two versions published by the UN.
[3]China Industrial News Information Center. http://www.cinic.org.cn/HTML/2005/1557/20062091016.html


