The Present Situation and Future Development of Urban-Rural Gap and Intra-Rural Gap in China
Mar 23,2007
By Zhang Junkuo, Hou Yongzhi & Xuan Xiaowei, Department of Development Strategy and Regional Economy of DRC
Research Report No.296, 2006
The urban and rural residents in China have seen their income growing remarkably since the beginning of reform and opening up. During the 1978~2005 period, the income of the urban residents increased from 343 yuan to 10,493 yuan, while that of the rural residents went up from 134 yuan to 3,255 yuan. However, the income gaps between the urban and rural residents, between different rural regions and between different groups of the rural residents have widened, though in varying degrees. The widening of these gaps has posed a grim challenge to the country’s sustained, steady and healthy development. Analyzing the history, present state and future trend of the urban-rural gap and the intra-rural gap is of vital importance to formulating unified strategies and policies for developing the urban and rural areas and for building a socialist new countryside and a harmonious society. This article will try to reveal the development trend of these gaps on the basis of analyzing the present state and evolving tracks of the urban-rural gap and the intra-rural gap.
I. The Present Situation and Evolving Track of the Urban-Rural Gap and Intra-Rural Gap
1.Urban-rural gap: this gap has been gradually widened on the whole since 1978 despite some fluctuations.
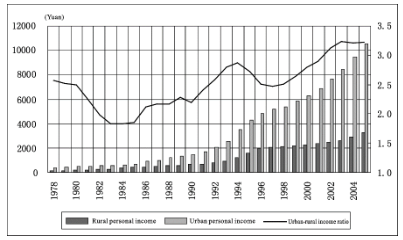
Since the beginning of reform and opening up, the changes in the income gap between China’s urban and rural residents roughly experienced five periods (chart 1). (1) The gap was continuously narrowing from the early years of the reform to the mid-1980s. (2) The gap was constantly widening from the mid-1980s to the early 1990s. (3) The gap rapidly narrowed in the mid-1990s. (4) The gap was continuously widening from the mid-1990s to the first three years of the 21st century. (5) The gap began to narrow slowly in 2004. But overall, the urban-rural gap has widened. In 2005, the ratio of the per capita disposable income of the urban residents to the per capita net income of the rural residents was 3.22, which was 25.3% higher than in 1978.

Chart 1 Changes in Income Gap between China’s Urban and Rural Residents since the Beginning of Reform and Opening up
The changes in the consumption gap between the urban and rural residents were largely similar to those in their income gap before 2001. But they were slightly different after 2001. The consumption gap between the urban and rural residents began to narrow in that year, earlier than the time when their income gap began to narrow (chart 2). Likewise, the consumption gap between the urban and rural residents was also widening in the overall term. In 2005, the urban-rural ratio in consumption was 3.56, 21.5 % higher than in 1978.
In the spatial term, the urban-rural gap varied considerably between regions. In 2004, the ratio of the per capita disposable income of the urban residents to the per capita net income of the peasants was 2.76 in the east region, 2.95 in the central region, 3.66 in the west region and 2.49 in the northeast regions. Compared at the level of provinces, the ratio was 2.20 in Jiangsu, 3.01 in Anhui, 4.01 in Shaanxi and 2.61 in Jilin. Apparently, the urban-rural gap was smaller in the regions with higher per capita GDP, and vice versa.

Chart 2 Changes in Consumption Gap between China’s Urban and Rural Residents since the Beginning of Reform and Opening up
2.Rural personal income gap between different regions. Compared at the level of provinces,, the gap changed dramatically during the 1990~1998 period, but became less intensive thereafter. Compared at the level of the four major geographic blocks, the gap in 2004 was larger than that in 1990, showing that the rural income gap between different regions has been widened.
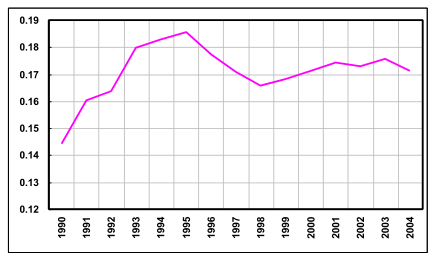
Chart 3 illustrates the Gini coefficient worked out on the basis of the per capita net income of the rural residents between different provinces. The chart indicates that the changes in the rural income gap between China’s different provinces roughly experienced three periods. (1) The gap widened rapidly before 1995, with the Gini coefficient rising from 0.144 in 1990 to 0.186 in 1995. It was a 29.2% growth, or an annual increase of 5.8 percentage points on average. (2) The gap narrowed rapidly during the 1995~1998 period. Within the three-year period, the Gini coefficient dropped by 10.8%, or decreased by 3.6 percentage points annually on average. (3) The gap widened slightly first and narrowed slightly later on after 1998. In the six years from 1998 to 2004, the Gini coefficient rose by 3.0%, or increased by 0.5 percentage points annually on average. But it should be realized that although the intra-rural gap in 2004 was smaller than the 1995 peak, it was higher than the 1990 level. The Gini coefficient in 2004 was 18.8 % higher than in 1990, exhibiting an annual increase of 1.3 percentage points on average.

Chart 3 Changes in Net Rural Income Gap between China’s Different Provinces since 1990s
The three curves in chart 4 respectively indicate the ratios of the per capita net income of the rural residents in the east region to those in the west, central and northeast regions. They show that the changes in the per capita rural income gap between the four major geographic blocks were not fully identical. The gap peaked in 1993 between the east and central regions, in 1995 between the east and west regions, and in 2000 between the east and northeast regions. But compared with the gap in 1990, the east region’s gap with all the other three major geographic blocks have widened, although in different degrees. The ratio of the per capita rural net income in the east region to that in the central region rose from 1.44 to 1.57, while the ratio of the east region to that of the west region rose from 1.57 to 1.93 and the ratio of the east region to that of the northeast region rose from 1.08 to 1.35.
...
If you need the full context, please leave a message on the website.


