


We have launched E-mail Alert service,subscribers can receive the latest catalogues free of charge

Features and Trends of China’s RegionalIndustrial Division and Cooperation
Dec 13,2006


By Feng Jie & Xuan Xiaowei
Research Report No 139, 2006
The degree of regional industrial division and industrial cooperation can reflect both the resource and industrial advantages enjoyed by different regions and the changes related to these advantages. It is also an important manifestation of the extent of marketization. This report mainly examines the inter-provincial distribution of China’s manufacturing and fundamental industries and the changes in this distribution in recent years and summarizes some of the new progress, features and trends in the process of regional cooperation.
I. Most of China’s Manufacturing Industries Have Posted a Rising Spatial Concentration Index and the Manufacturing Sector as a Whole Is Highly Concentrated
The changes in the spatial concentration index of the manufacturing industries are an important manifestation of the trend of industrial division of labor and industrial transfer between different regions. Table 1 indicates that the average spatial concentration index of China’s 20 manufacturing industries in 2003 (also called the industrial spatial Gini coefficient, which measures the distribution of productivity, namely, total output values, of various industries in 31 provinces and regions) was 0.597. Overall, the manufacturing sector has shown a feature of highconcentration. Specifically, the highly concentrated industries with their spatial concentration index being higher than 0.7 including electronic and telecommunications equipment (0.801), chemical fibers (0.782), instruments and office machinery (0.763), textiles (0.731), electric machinery and equipment (0.724) and metal products (0.722). There were only a few industries whose spatial concentration index was lower than 0.5. They were nonferrous metal smelting and rolling (0.439) and pharmacy (0.463). In terms of the process of changes, Chart 1 indicates that most manufacturing industries saw their spatial concentration index rising continuously since 1999. On average, the spatial concentration index of the 20 industries in 2004 was 3.32 percent higher than five years before. In particular, the industries whose spatial concentration index was over 10 percent higher were papermaking and paper products (10.2 percent) and chemical fibers (10.1 percent). The industries whose spatial concentration index was over 5 percent higher were chemical raw material and chemical products (8.3 percent), food processing (6.7 percent), electronic and communications equipment (6.3 percent) and metal products (5.2 percent). In the meantime, there were four industries that saw their spatial concentration index declining. The two industries that posted the most dramatic decline were special equipment (-7.1 percent) and tobacco processing (-6.3 percent). In addition, food production (-1.3 percent) and petroleum processing and coke production (-0.9 percent) also saw their concentration falling slightly. In general, the above information indicates that the degree of specialized division of labor based on market competition and on scale of economy was constantly rising, but some industries (such as the auto, pharmacy, tobacco and liquor industries) were still noted for scattered distribution of productivity due to the impact of regional protectionism and industrial administrative system.
Table 1 Spatial Concentration index and Its Changes of China’s Manufacturing Industries over Past Five Years
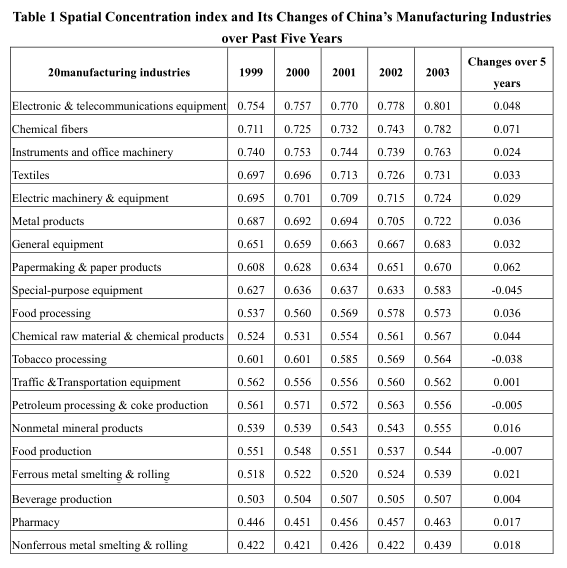
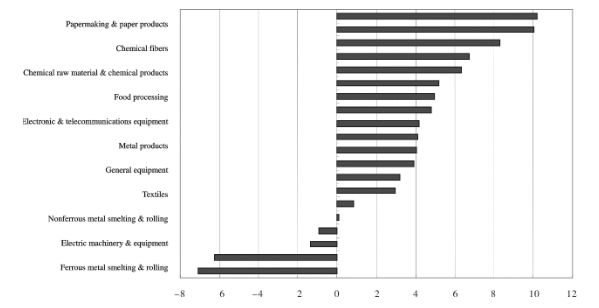
Chart 1 Spatial Distribution Change of China’s Manufacturing Sectors 1999-2003 (%)
II. The Manufacturing Industries AreMainly Located in the East Coastal Region, Mostly Concentrated in Guangdong, Shandong, Jiangsu and Zhejiang Provinces and Shanghai, and Are Gradually Moving Northward
Table 2 Concentration Ratio and its Change of the Total Industrial Output Values of the Manufacturing Industries in Top 3 Provinces
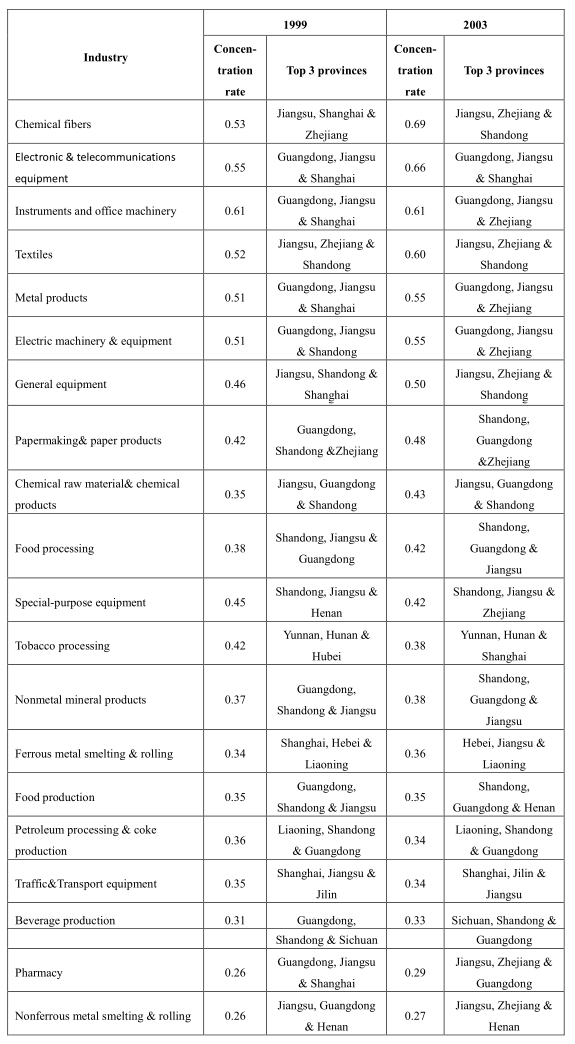
As indicated in Table 2, the concentration ratio (the ratio of the top three provinces’ total industrial output values to the national total) of the 20 manufacturing industries ranged widely between 0.69 and 0.27 in 2003. Except for Yunnan and Hunan (tobacco processing), Henan (food production), Jilin (traffic&transport equipment) and Sichuan (beverage production), the provinces and regions in the central and western regions of the country were all excluded from the top three provinces in terms of total industrial output values. Most industries are highly concentrated in the east coastal region. In particular, Guangdong, Shandong, Jiangsu, Zhejiang and Shanghai together claimed more than half of the total industrial output values of the 20 manufacturing industries. The changes in recent years indicate that the proportion of the output values of the Bohai Sea Rim region has been constantly rising. Of the 20 manufacturing industries, the Pearl River Delta, the Yangtze River Delta and the Bohai Sea Rim respectively claimed nine, seven and three in 1999, with the highest proportions of total industrial output values. In 2003, this ratio changed to 4:7:7, with the Bohai Sea Rim region (the group of Shandong, Hebei and Liaoning) having a visibly higher rate of industrialconcentration.
…
If you need the full text, please leave a message on the website.


