


We have launched E-mail Alert service,subscribers can receive the latest catalogues free of charge

The Internal Trend of China’s Economic Growth and Its Periodic Fluctuations
Jun 01,2006


By Li Jianwei
Research Report No 017, 2006
I. The Estimates on the Potential Growth Rates of China’s Economy and the Characteristics of Their Periodic Changes
When making estimates on the potential output level, nations usually use the long-term trend of actual output as a substitution for the potential output level. In estimating on the potential output level, we also use the development trend of actual output worked out by Hodrick-Prescott Filter (HP Filter) as a substitution for the calculation of the country’s potential output level.
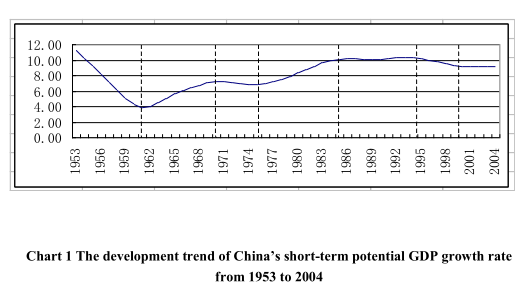
1.The estimates on the potential short-term growth rate of China’s GDP and the characteristics of its periodic changes
After China’s GDP growth from 1953 to 2004 is treated with HP Filter, the short-term fluctuation of GDP growth rate and the partial impact of accidental shock on GDP growth are filtered, and we get the short-term development trend of GDP growth or short-term potential output growth rates (Chart 1). The development trend indicates that the country’s short-term potential growth rates have experienced the following seven development stages: (1) Continuous decline stage: The short-term GDP potential growth rate was decreased year-on-year from 11.27% in 1953 to 3.85% in 1961; (2) Accelerated development stage from 1961 to 1970: The GDP short-term output growth rate increased year-on-year from 3.85% in 1961 to 7.23% in 1970; (3) Relatively stable development stage from 1970 to 1975: The short-term potential GDP growth rate tended to decline slightly with the rate declining from 7.23% in 1970 to 6.85% in 1975; (4) Accelerated growth stage from 1975 to 1985, the short-term potential GDP growth rate rose year-on-year from 6.85% in 1975 to 10.11% in 1985; (5) High-speed growth stage from 1985 to 1995: The short-term potential growth rate was always between 10.07% to 10.38%; (6) Adjustment stage from 1995 to 2001, the short-term potential GDP growth rate slightly declined year-on-year from 10.19% in 1995 to 9.14% in 2001; (7) Relatively stable growth stage since 2001: The short-term potential GDP growth rate from 2001 to 2004 was kept between 9.12% to 9.14% from 2001 to 2004, and the average rate was 9.13%.
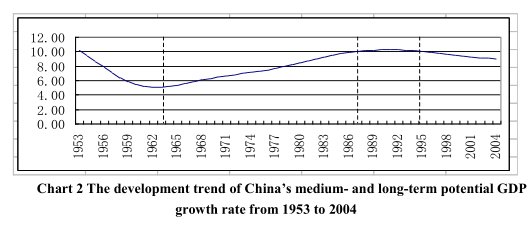
2.The medium- and long-term potential GDP growth rate of China and the characteristics of its periodic changes
The HP Filter treatment of short-term potential GDP growth rate results in a smooth S-shaped medium- and long-term potential GDP growth rate curve (Chart 2). The medium- and long-term potential GDP growth rates approximately experienced four development stages: (1) The continuous decline stage from 1953 to 1963: The medium- and long-term potential GDP growth rate decreased year-on-year from 10.23% in 1953 to 5.07% in 1963; (2) Accelerated growth stage from 1963 to 1987: The medium- and long-term potential GDP growth rate increased year-on-year from 5.07% in 1963 to 10.05% in 1987; (3) High-speed stable growth stage from 1987 to 1995: The medium- and long-term potential GDP growth rate had maintained at 10.04% to 10.26% with the average rate at 10.17%; (4) Slowed growth stage from 1995 to 2004: The medium- and long-term potential GDP growth rate saw an continuous decline from 10.04% in 1995 to 8.96% in 2004 with the annual average decline of 0.12 percentage point.
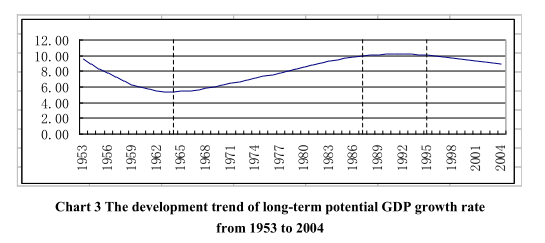
3.The long-term potential GDP growth rate and its characteristics of periodic changes
The HP Filter treatment of medium- and long-term potential GDP growth rate then results in the long-term potential GDP growth rate. China’s long-term potential GDP growth rates witnessed the four development stages: (1) Continuous decline stage from 1953 to 1964: The long-term potential GDP growth rate declined year-on-year from 9.52% in 1953 to 5.38% in 1964; (2) Accelerated growth stage from 1963 to 1988: The long-term potential GDP growth rate increased from 5.38% in 1964 to 10.06% in 1988; (3) High-speed stable growth stage from 1988 to 1995: The long-term potential GDP growth rate had been kept at 10.03% to 10.21% with the average growth rate standing at 10.14%; (4) Continuous decline stage since 1995: The rate had declined to 8.97% by 2004.
II. The Characteristics of Periodic Fluctuations of China’s GDP Growth Rate and Their Convergence and Divergence Analysis
In the light of the divergence of actual GDP growth rate and potential growth rate, China’s economic growth has witnessed short-term, medium- and long-term and long-term endogenous fluctuations with an average range of 6, 12 and 17 years. There existvarious differences between the fluctuations and fluctuation ranges of the three periodic fluctuations. It is mainly because the changes of economic systems, government policies and world economic situations have dealt major external shocks, which then change the direction of economic fluctuation and even change the direction of the short-term and medium- and long-term potential growth rate in a short period of time. But the long-term fluctuation of the GDP growth rates tends to converge at the long-term potential growth rates. Therefore, the external shocks can hardly change the long-term development trend of economic growth.
1.The characteristics of short-term GDP growth rate fluctuations and theirconvergence and divergence analysis
We use the divergence of the actual GDP growth rate and short-term potential growth rate as the short-term fluctuation index. The short-term fluctuations of GDP growth rate bear the following three characteristics: (1) The policy factors and accidental shocks have exerted a great impact over the short-term GDP periodic fluctuations. From 1953 to 2004, these were the periods when great fluctuations occurred to GDP growth rates and when major policy adjustments were made or the country was hit by serious accidental shocks, such as the "Great Leap Forward" and three-year major natural disasters from 1958 to 1964, and the Asian financial crisis in 1997. (2) Short-term periodic fluctuations are very irregular. The average range of short-term GDP growth rate fluctuations between 1953 and 2004 is six years. But there exists much difference between the short-term fluctuations in various periods, the shortest being two years and the longest being twelve years. (3) The fluctuation ranges tend to be narrowed and the general fluctuation trend converges. The fluctuation ranges of various periods after 1978 were obviously smaller than that before the initiation of reform and opening up. The trend is that the overall fluctuation eventually converges at the short-term potential growth rates.
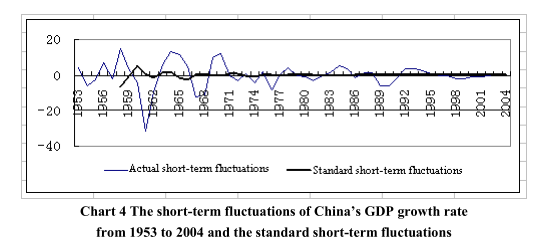
Note: The standard short-term fluctuation curve is obtained from the simulation estimation through the regression equation of actual short-term fluctuations. The standard equation is as follows: GWS=0.2585*GWS (-1)-0.2439*GWS (-2)-0.4164*GWS (-3) +0.0315, of which, GWS represents the short-term fluctuation range of GDP growth rate.
…
If you need the full text, please leave a message on the website


