


We have launched E-mail Alert service,subscribers can receive the latest catalogues free of charge

Development Trend of Chinese Regional Disparities in Recent Years
Mar 15,2006


By Li Shantong & Xu Zhaoyuan
I. Introduction
Since China began reform over twenty years ago, its economy has posted continuous rapid growth. The living standard of Chinese people across all regions has consequently improved. China is a developing country with a vast territory and a huge population. Because of the differences in regional, geographic, climatic and other natural conditions and also cultural and historical conditions, different regions have different conditions for development and different development bases and are developing at different speeds. This has resulted in inter-regional imbalances in development and income. Since the 1990s in particular, regional disparities have been widening in China and have caught extensive government and social attention. Many economists have studied regional disparities in China. A majority believes that Chinese regional disparities narrowed somewhat in the 1980s but have been widening since the 1990s (Liu Xiaming, 2004; Li Shantong, 2004; Wang Xiaolu, 2004; etc). Since 2000, however, the pattern of macroeconomic growth in China has changed enormously. As far as regional policies are concerned, the country has introduced a western development strategy as well as policies to rejuvenate old industrial bases in northeast China. For this reason, we need to have a further study of the impact these policies are having on patterns in Chinese regional economic growth and changes in developing trends in regional disparities. This article will focus on exploring developing trends in regional disparities since 2000.
The second part of this article is devoted to analyzing changes in regional disparities in China by using a number of indicators. The third part analyzes changes in regional growth patterns and the impact that this has on regional disparities. The fourth section explores factors which have affected changes in regional disparities since 2000, while the fifth section is devoted to conclusions and policy options.
II. Changes in Development Trends in Regional Disparities in China since Reform and Opening up
There are many indicators for measuring regional disparities. The most frequently used are the Gini coefficient, CV coefficient, Theil index, with un-weighted or population-weighted maximum and minimum values. Of all these, the Gini coefficient is the simplest and easiest to understand. This article mainly uses the Gini coefficient to measure regional disparities.
1. Calculations based on the Gini coefficient
We use the Gini coefficient to analyze indicators (per capita GDP and personal consumption levels) that typically reflect levels of economic development and states of personal wellbeing. Per capita GDP at current prices is the indicator that is most frequently used to reflect the state of regional development and reflect the overall level of development of a specific region. But it cannot completely and accurately reflect the level of wellbeing of residents in any given region. This is because as different regions have different rates of investment, and there can be drastically different levels of consumption in regions sharing the same per capita GDP. Additionally, since different regions have different price levels, the same per capita GDP can imply quite different purchasing powers. The level of personal consumption is closely related to per capita GDP. But the two do not always conform with each other because of inter-regional shifts in factor incomes and transfer payments as well as the different rates of investment mentioned above. In general, regional disparities worked out on the basis of personal consumption levels are smaller. Taking 2004 for example, it can be noted that the maximum value of per capita GDP for Shanghai was 13 times the equivalent minimum value for Guizhou, while the same value measured using personal consumption shows the maximum value for Shanghai only 9 times higher than the minimum value for Guizhou. In the relative terms, the level of personal consumption reflects personal welfare more directly. Working out the Gini coefficient using both per capita GDP as well as levels of consumption offers a comprehensive way to work out changes in regional disparities.
2. Changes in regional disparities measured by Gini coefficient
The following figure illustrates the changes in regional disparities in China during the 1978-2004 periods as measured by the Gini coefficient. During the 1978-1990 periods, the Gini coefficient fell rapidly as calculated with per capita GDP at current prices, from 0.359 in 1978 to 0.277 in 1990. In the 1990s, the Gini coefficient expanded rapidly at first before slowing down slightly. From 2000 to 2003, regional disparities continued to widen, though less violently. The value remained at about 0.35. In 2004, the Gini coefficient even dropped somewhat (one percent below its 2003 level). Compared with the early years of reform and opening up, the current Gini coefficient worked out on per capita GDP at current prices is lower than that for 1978.
Source: Per capita GDP at current prices is based on data from regional statistical yearbooks. If the data differ between years, please refer to the latest data. 2004 data come from the 2005 China Statistical Yearbook. As Chongqing’s per capita GDP in the statistical yearbook is based on its permanent population and differs from historical data, this article has made adjustments. Data on personal consumption levels come from China Statistical Yearbooks and some figures are updated according to regional statistical yearbooks.
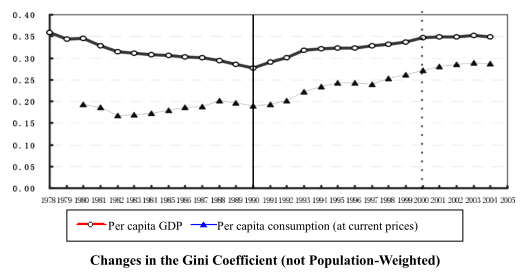
The Gini coefficient based on personal consumption levels indicates that regional disparities have been steadily rising since 1982. Disparities in regional levels of consumption rose fairly slowly before the 1990s, but continued to widen after the 1990s despite slight declines in the Gini coefficient in 1996 and 1997. However, the widening momentum slowed down gradually after 2000 and the 2004 Gini coefficient was largely at the same level as 2003. The above figure also indicates that regional disparities measured by levels of personal consumption have always been lower than results based on per capita GDP. Compared with the early years of reform and opening up, current regional disparities in consumption levels are far higher than in 1978.
The above analysis of the Gini coefficients based on per capita GDP and personal consumption levels indicates that the widening in Chinese regional disparities has gradually slowed down since 2000.
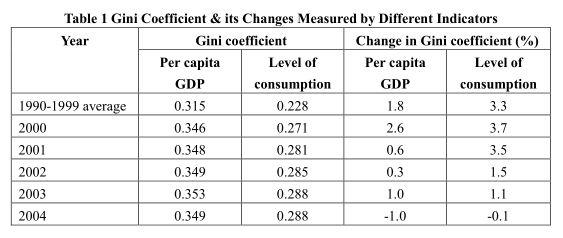
Table 1 indicates that Gini coefficient in 2000 was visibly higher than in the previous year but that growth in Gini coefficient shows a clear progressive decline in the following years regardless of indicator used. In particular, the Gini coefficient based on per capita GDP at 2004 prices was 1 percent lower than in 2003. Although the Gini coefficient based on personal consumption levels rose rapidly after 1990, it dropped 0.1 percent in 2004 from the previous year.
3. Regional disparities in the Gini coefficient based on per capita GDP weighted by registered population and permanent population
Chinese regions usually use two parameters for demographic statistics: registered population and permanent population. In some regions, these two statistical indicators are not quite different. But in some developed regions with large numbers of migrants, the two indicators are drastically different. For example, Beijing had a registered population of 11.488 million and a permanent population of 14.564 million. When computing per capita GDP, the National Bureau of Statistics does not use a unified demographic indicator. For example, when computing the 2004 per capita GDP, the "registered population" was used for Beijing, Tianjin, Shanghai and Sichuan while the "permanent population" was used for other regions (see the 2005 China Statistical Yearbook). As the three municipalities directly under the central government had more permanent residents than registered residents, their per capita GDP values based on the permanent population would be smaller than the statistical values. Accordingly, if all regions base their statistics on permanent population, regional disparities would be smaller than those worked out in this article. In 2000, for example, the Gini coefficient based on per capita GDP at current prices would be 0.301 if the permanent population was used. The Gini coefficient based on the data of the statistical yearbooks was 0.347. There is a considerable gap between the two parameters.
…
If you need the full text, please leave a message on the website.


