


We have launched E-mail Alert service,subscribers can receive the latest catalogues free of charge

Growth of Productivity and Sustainable Economic Growth in China
Dec 13,2002


Li Shantong, Hou Yongzhi, Wu Yanrui and Liu Peilin Research Report No 108, 2002
China has maintained a high-speed economic growth for two decades since 1978. With the start of the new century, the Chinese economy has also entered a new phase of development. Whether or not Chinese economy can maintain its rapid growth during this new period of history has aroused wide concern at home and abroad.
The answer to this question lies in one’s understanding of the performance of Chinese economy, especially the understanding of the role of productivity in China’s economic growth over the past 20 years. This paper will first present an analytical framework and then examine China’s productivity growth in the past and its trend of development in the future. Finally, we will shed some light on the sustainable growth of the Chinese economy.
I. The Analytical Framework: An Extended Solow Approach
1. Documentary origins of the analytical approach used in this paper
The analytical approach adopted in this paper has two documentary origins: the analytical framework for calculating growth proposed by Solow in 1957, and the method for measuring technological efficiency put forward by Farrell et al..
According to Solow’s analytical framework, economic growth is decomposed into input of key factors and contribution from improvement of efficiency of all factors, as shown in the following equation:
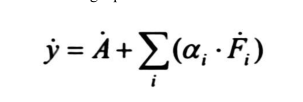
In this formula, Y represents the growth rate of output, F stands for the growth rate of key factors of production, αi, meanwhile, indicates the proportion of the remunerations of various key factors of production in output. (The sum total of the remunerations of various key factors in production under the condition of full competition and neutrality of scale remuneration is 1, precisely. In other words, the remunerations of various key factors of production divide up total output completely.) stands for the growth rate of productivity of key factors of production. The economic meaning commonly attributed to it is technological progress.
As a matter of fact, however, what measures is the result of joint action of multiple factors. According to recent documentary progress, can be further decomposed into two parts: (1). Movement of production function itself, or technological progress in a stricter sense. (2). Effect of changes in output resulting from changes in technological efficiency. To explain the second effect, it is necessary to define the concept of technological efficiency at first.
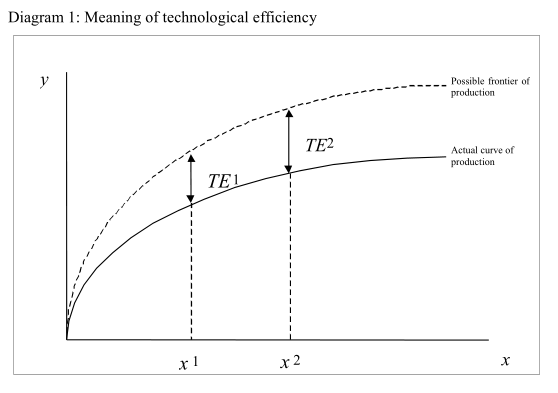
As is known to all, what production function stands for is the maximum output achieved by an industry under the condition of best software and management expertise. But the actual output level set by many economic entities under the condition of certain input is usually lower than that of their potential output. The difference between actual and potential output levels is technological efficiency. Diagram 1 shows the meaning of technological efficiency under the condition of input of a single key factor. The x axle in the diagram stands for the amount of input of the key factor, the y axle represents output, and TE1 and TE2 show the technological efficiency when the level of input stays at x1 and x2 respectively. Farrell (1957), Aigner, Lovell, Schmidt (1977), and Meeusen and van den Broech (1977) have constructed a method for measuring technological efficiency.
Diagram 1: Meaning of technological efficiency
If the method developed by Farrell et al. is used, the in Solow’s framework can be divided into two parts -- technological progress and change of technological efficiency, thus deepening analyses of productivity and economic growth.
So far as China is concerned, economic reform influences productivity growth through two channels, theoretically. One is to improve the utilization efficiency of existing resources, that is, to improve the output level by way of revolution to let it approach the possible frontier of production (to improve technological efficiency), the another channel is to promote innovation and invention, that is, technological progress. It helps a lot to review the changes that have taken place in China’s productivity, especially the changes that have taken place in the two component parts of productivity, when we try to understand the root cause of China’s economic growth over the past two decades and forecast its prospect in the future. To this end, the paper extends the traditional Solow method by integrating it with the method mentioned above to construct a new analytical framework for studying productivity and economic growth.
2. The method adopted in this paper and its characteristics
The basic production function used in this paper is transcendental logarithmic production function. The key factors of production involved include input of capital and labour forces. The following assumptions have been included in the model designing: (1). The remunerations of production scale remain unchanged. (2). The output elasticity of capital and labour changes with time, and the structure of production function changes accordingly. (3). Technological progress moves at different speed during different period of time. (4). Technological efficiency changes with time. The different speed of these changes in different areas have also been taken into consideration.
According to the Solow growth accounting method, productivity growth comes mainly from technological progress. According to the method used in this paper, however, productivity can be decomposed into two parts: efficiency improvement and technological progress. The former is attributable to the move toward the possible frontier of production, while the latter is attributable to the move of the possible frontier of production itself. Even without technological progress, underdeveloped countries and regions can achieve positive productivity growth by narrowing the gap between their output and optimum output (improvement of efficiency).
This method of decomposition distinguishes, from a quantitative angle, the effect produced by economic reforms on the level and growth of long-term economic growth (Lucas, 1988). On the one hand, the level effect of economic reforms leads to growth of actual output (move toward the possible frontier of production), and on the other hand, the growth effect means that economic reform leads to sustainability of economic growth by raising the level of production in the short run and stimulating technological progress. A fundamental difference between these two effects is that level effect may disappear with the elapse of time, while growth effect will stay or even expand.
II. Source of Data and Their Processing
The model specified above is used to analyze the panel data of 27 Chinese provinces and autonomous regions between 1981 and 1997. The data from Tibet are incomplete. There are no data of the time sequence from Hainan because it was established as a province only in 1988. Chongqing was established as a municipality in 1996, so it was included in Sichuan Province for calculation in this paper. Preliminary graphic analysis shows that the data of the time sequence from Qinghai Province are highly questionable. For this reason, these four regions are not included in the data samples.
The GDP data for the provinces, autonomous regions and municipalities are from the State Bureau of Statistics. The 1981-1984 statistics of labour forces are taken from the China Yearbook of Statistics, with the statistics for the period 1981-1984 obtained by the extrapolated method. In order to turn the nominal GDP data into GDP of invariant price, a price reduction index is worked out with nominal GDP and actual growth rate of GDP. The total number of the employed is used in this paper due to lack of data on the "man/hours".
...
If you need the full context, please leave a message on the website.


